 2016, Vol. 34
Institute of Oceanology, Chinese Academy of Sciences
Article Information
- ZHANG Jun(张俊), CHEN Guobao(陈国宝), CHEN Zuozhi(陈作志), QIU Yongsong(邱永松), XIONG Dan(熊丹)
- Application of hydroacoustics to investigate the distribution, diel movement, and abundance of fish on Zhubi Reef, Nansha Islands, South China Sea
- Chinese Journal of Oceanology and Limnology, 34(5): 964-976
- http://dx.doi.org/10.1007/s00343-016-5019-z
Article History
- Received Jan. 21, 2015
- accepted in principle Mar. 26, 2015
- accepted for publication Jul. 7, 2015


2 Key Field Scientific Experimental Station of South China Sea Fishery Resource and Environment, Ministry of Agriculture, Guangzhou 510300, China;
3 Key Laboratory of South China Sea Fishery Resources Exploitation and Utilization, Ministry of Agriculture, Guangzhou 510300, China;
4 College of Marine Sciences, Shanghai Ocean University, Shanghai 201303, China
Coral reefs are unique ocean ecosystems that contain abundant fishery resources (Polovina, 1984; Pandolfi et al., 2003). However, these ecosystems are fragile and have been significantly affected by human activities (Nyström et al., 2000; Pandolfi et al., 2003; Bellwood et al., 2004; Lan and Chen, 2006; Harris et al., 2013). The South China Sea is a globally significant area because of its shallow tropical water and high biodiversity, and is one of the world’s primary centers for coral reef diversity (Chen, 1997; Ng and Tan, 2000; UNEP, 2004; Chen and Li, 2005; Melbourne-Thomas et al., 2011; Zhao et al., 2012). A number of studies have documented the distribution of coral reef fish and other fauna in the South China Sea with particular emphasis on biodiversity and community structure.
Most studies on coral reef fish in the South China Sea have been conducted using traditional sampling gear, such as gill nets, hand-lines, or long lines, because of the delicate physical nature of the reefs (Li et al., 2003; Sun et al., 2005; Chen et al., 2007; Li et al., 2007; Wang et al., 2011). However, the use of traditional survey gear makes it difficult to obtain accurate information on the spatial distribution and movement of coral reef fish, and only limited information on the composition and distribution of fish resources is available for a number of important coral reefs in the South China Sea. Acoustic estimates of fish abundance are convenient and efficient to survey and quantify the abundance of marine resources (MacLennan and Simmons, 1992; Simmons and MacLennan, 2005). Hydroacoustic techniques are an alternative low-impact method to sample fish; thus, they are an ideal tool for evaluating the status of coral reef fishery resources (Mitson et al., 1996; Huse and Ona, 1996; Gledhill et al., 1996; Mason et al., 2005; Anderson et al., 2005; Zwolinski et al., 2007; Koslow, 2009).
The objective of this study was to conduct surveys of fisheries resources using a combination of acoustic and traditional methods to investigate spatial and temporal distributions and movement patterns of coral reef fish on Zhubi Reef in detail to enhance our understanding of this ecosystem.
2 MATERIAL AND METHOD 2.1 Survey siteZhubi Reef is located southwest of the Zhongye Islands in the Nansha Islands, South China Sea (Fig. 1a). This reef is a closed atoll, approximately pear-shaped in the NE-SW direction, 5.75 km in length, 3.25 km in width, and~16.1 km2 in area. The middle lagoon is~9.5 km2, and the majority of the area is~20 m deep with a maximum depth of 24 m (Yin et al., 2011).

|
| Figure 1 Location of Zhubi Reef Inset: close-up of Zhubi Reef (a), and survey line and sampling sites (b). |
Temperature and salinity were determined in situ using a YSI ProPlus meter (YSI Inc., Yellow Springs, OH, USA). Mean temperatures (mean±standard deviation [SD]) of the surface and bottom layers were 29.82±0.04 and 29.70±0.06℃, respectively, and mean salinity values (mean±SD) of the surface and bottom layers were 33.78±0.12 and 33.74±0.10, respectively (Yin et al., 2011). Tidal range was 0.38- 1.49 m (Wu et al., 2001). The surrounding habitat type was scleractinian coral. Sunrise and sunset at the study location during the study period occurred at 06:02-06:03 and 18:45-18:47, respectively. The survey line and sampling sites are indicated by solid lines and square symbols (S1-S3) in Fig. 1. S1 (10°55.10′N 114°4.75′E, 21.8 m) and S3 (10°55.90′N 114°5.75′E, 17.8 m) were hand-line sites, and S2 (10°55.50′N 114°5.25′E, 19.7 m) was a gill netting site. Stationary continuous acoustic samples were taken at the S3 site. The S1-S3 sites were chosen to set a sample site in each transect. The difference in latitude at the three sites was 0.40′.
2.2 Acoustic data collectionAcoustic data were collected using a Simrad EK60 scientific echosounder (Kongsberg Maritime Inc., Kongsberg, Norway) with 38 and 120-kHz split-beam transducers mounted on the “NanFeng” survey vessel. Only the 120-kHz data were used here because of the shallow depths and small-sized fish. The acoustic equipment was calibrated before the cruise using the standard procedure described in the Simrad ER60 reference manual (Foote et al., 1987; Simrad, 2008). Detailed echosounder settings are given in Table 1. Two types of acoustic surveys (transects and stationary) were conducted on Zhubi Reef. The transect survey was designed to systematically sample the entire reef system to estimate fish abundance and spatial distribution in the system. The transect tracks shown in Fig. 1b were sampled at four different time periods of 07:00-10:00, 13:00-16:00, 18:00-21:00, and 21:00-24:00 on June 21, 2013. The stationary acoustic survey was designed to study temporal and vertical distributions and movement of fish. The acoustic data were collected continuously from 00:00 on June 22 to 24:00 on June 23, 2013 at the S3 site shown in Fig. 1b. We did not collect acoustic data concurrently with biological data during the transect survey; however, we collected acoustic data concurrently with biological data during the stationary survey.

Biological samples were collected by hand-line and gill net from a motor lifeboat with a compression ignition internal combustion engine. The power and speed of the engine were 14.7 kW and 1 500 r/min, respectively. The length and width of the boat were 7.85 and 1.50 m, respectively. Hand-lining was conducted at the S1 site during 07:00-22:00 on June 21 and at the S3 site during 07:00-22:00 on June 23, 2013. Gill netting was conducted at the S2 site during 12:00-17:00 on June 23, 2013. The specifications of the hand-line and bottom gill net are given in Table 2. The gill nets were fished by linking three nets in a row. We recorded fish species, number (inds.), body length (mm), and wet body mass (g) using a lever scale. Each species was dissected on-board to obtain information on swim bladder type and size to understand the acoustic backscattering characteristics of the fish sampled. Fish swim bladders are inflated at the surface (expanded to twice the volume) compared with their volume at a depth of 10 m (Foote, 1980; Simmonds and MacLennan, 2005; Zhao et al., 2006).

Acoustic data were analyzed using Echoview 4.9 (Myriax Software Pty Ltd, Battery Point, TAS, Australia). Depth of analysis was from 4 m below the transducer to 0.5 m above the seabed, and maximum depth was 20 m. Volume backscattering strength (Sv) threshold and target strength (TS) threshold were -80 dB and -72.5 dB, respectively. Echo integration, TS, and single-target detection analyses were performed on the acoustic data collected during the transect and stationary surveys.
Each transect was divided into 200-m segments and analyzed in 4-m-depth layers. Temporal and vertical distributions of single-target detections and the entire 24-h periodic variation in Sv were studied based on the stationary acoustic data collected at the S3 site. The nonparametric Kolmogorov-Smirnov Z and Kruskal-Wallis tests were used to determine significant differences in the TS distribution among the different time periods and depths, and the nonparametric Wilcoxon test was used to determine significant differences in the Sv distribution among the different depths (Lu, 2010).
Crescent-shaped or wavy-shaped (from crescent plus platform movement) groups of samples or target samples that looked like fish tracks were used as clues to identify the presence of single targets (Higginbottom et al., 2008). The single-target detection echogram was used to extract and analyze single targets. The TS vs. depth distribution and the TS frequency distributions at different depths and time periods were analyzed using the target detection function in Echoview software (Table 3). We used TS as an indicator of fish length (Foote, 1987; Rudstam et al., 2003). The estimated corresponding body length (l, cm) of fish for a given TS was based on the formula: TS=20lgl+b20 and specific b20 shown in Table 4 (Simmonds and MacLennan, 2005). A dissection indicated that the majority of fish had a swim bladder and that most were physoclistous. Consequently, the b20 value is≤-72.5 dB for most fish on Zhubi Reef (Simmonds and MacLennan, 2005). Thus, fish with TS values < -60, -60 dB≤TS < -45 dB, -45 dB≤TS < -35 dB, and -35 dB≤TS were classified as very small-, small-, medium-, large-sized, and very large fish, respectively.


Fish density, ρ (inds./m3), was calculated using echo counting and echo integration methods. Fish that are well separated from one another can be detected using echoes from individual fish, and the echo count can be used to determine fish density within the acoustic beam (Trout et al., 1952; Midttun and Sætersdal, 1957). The number of insonified fish, the sampled volume of fish, and the ρ formula from the echo counting method are needed for this purpose (Simmonds and MacLennan, 2005; Higginbottom et al., 2008):
 (1)
(1)where V is beam scanning volume in m3, and N is the number of single targets detected in water volume (V) computed by Echoview software.
The principle of echo integration is to quantify the intensity of fish school echoes using an echo integrator, to estimate the number of fish by dividing echo strength by TS of a single-target fish species, and use the ρ formula (Simmonds and MacLennan, 2005; Higginbottom et al., 2008):
 (2)
(2)where
 (3)
(3) (4)
(4)where NASC is the nautical area scattering coefficient in m2/nmi2, σ is the mean backscattering crosssection in m2, 1 8522 is the conversion coefficient between nmi2 and m2, H is the mean water depth in m, n is the total species estimated, TSi is the target strength of the ith species estimated in dB, %contribution/100 is the number percentage of ith species estimated, li is the mean body length of the ith species estimated in cm, and b20, i is reduced TS in dB. The b20 value for fish in this study was generally between -72.5 and -68.0 dB (Zhao et al., 2003; Chen et al., 2012; Zhang et al., 2013).
Data entry and statistical analyses were performed using Microsoft Excel 2010 (Microsoft, Inc., Redmond, WA, USA) and SPSS 16.0 software (SPSS Inc., Chicago, IL, USA), respectively.
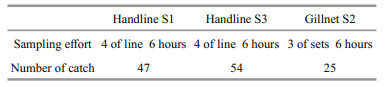
3 RESULT 3.1 Species compositionA total of 126 individual (total wet weight, 9.71 kg) fish were captured, belonging to 29 species, 20 genera, 17 families, three orders, and two classes. Perciforms were represented by 15 families and 18 genera, Beryciformes by one family and one genus, and Aulopiformes by one family and one genus. The most abundant species (% of total catch) were Pentapodus caninus (29.4%), Gnathodentex aurolineatus (23.0%), Apogon taeniatus (10.3%), Lutjanus kasmira (4.8%), and Pristicon rhodopterus (4.8%), respectively. The species contributing most to biomass (% of total biomass) were G. aurolineatus (29.5%), P. caninus (25.9%), L. kasmira (10.1%), Lutjanus erythropterus (5.6%), and Oxycheilinus digramma (5.6%). The detailed composition of the catches is given in Table 5. The body length (BL) distribution of the catches was represented by two size groups (Fig. 2). The smaller group was 62-105 mm (mean±SD, 91±9 mm) and mostly comprised Pomacentrus and Apogon. The larger group was 106- 240 mm (mean±SD, 150±25 mm) and mostly comprised Gnathodentex, Pentapodus, and Lutjanus. Sampling effort and the number of fish captured at the different sites are given in Table 6.

|
| Figure 2 Body length distribution of fish caught on Zhubi Reef |

|
The distributions of the single-target detections are presented as a function of TS and depth during the four time periods (Fig. 3). In general, the proportions of medium-sized and large-sized fish increased gradually as depth increased. The number of singletarget detections was significantly higher at night (11 006 and 10 343) than during the day (5 749 and 4 907) (t-test, P=0.012). The distribution patterns also differed between night and day. Two distinct target detection clusters were observed during the day (Fig. 3c, d); one group consisted of very small fish (TS < -60 dB) distributed above a depth of 17 m and the other consisted of small, medium, and large-sized fish (TS > -55 dB) primarily below a 10-m depth. The very small fish distributed at 10-18 m migrated up during the night, and many small targets (-60 dB < TS < -50 dB), which were nearly nonexistent during the day, appeared above 10 m to form a large target detection cluster (Fig. 3a, b).

|
| Figure 3 Target strength (TS) vs. depth graph for single fish distributed at different times a: 18:00-24:00; b: 24:00-06:00; c: 06:00-12:00; d: 12:00-18:00. n: number of single fish distributed during the different time periods from 18:00 on June 22 to 18:00 on June 23, 2013. |
The single-target TS frequency distributions during the day and night (Fig. 4 and Table 7) were further analyzed in the different layers (4-8, 8-12, 12-16, and 16-20 m). The proportions of single targets in the different layers during the day were 12.2%, 32.8%, 38.7%, and 16.3%, respectively, whereas the proportions at night were 21.2%, 33.7%, 32.4%, and 12.7%, respectively (Fig. 4). The TS distributions for all layers at night were unimodal, whereas the TS distributions for the 12-16-m (modes A and B in Fig. 3c) and 16-20-m layers (modes C and D in Fig. 3d) were bi-modal during the day, reflecting the separation between the two size groups. The singletarget TS frequency distributions during the day were significantly different from those at night for the 4-8-m (P < 0.01), 8-12-m (P < 0.01), 12-16-m (P < 0.01), and 16-20-m layers (P < 0.01). Significant differences existed among the 4-8, 8-12, 12-16, and 16-20-m layers during the day (P < 0.01) and night (P < 0.01).

|
| Figure 4 Target strength (TS) frequency distribution for single fish in the different depth layers during the day and night n: number of single fish distributed during the different time periods from 18:00 on June 22 to 18:00 on June 23, 2013. |

|
The proportions of very small, small, medium-, large, and very large-sized fish were 79.7%, 17.6%, 2.6%, and 0.1% during the day after aggregating TS into four size classes in the entire water column, whereas these values were 61.4%, 36.8%, 1.7%, and 0.1%, respectively, at night. Very small and smallsized fish accounted for > 95% of abundance.
3.3 Echo integration and volume backscattering strength (Sv)Diel vertical movements of fish were observed on echograms recorded continuously at the stationary sites. Fish began to spread and move upward between 18:10 and 18:40, just before sunset (Fig. 5). The fish assembled before descending at 06:20, about 15 min after sunrise, and completed their descent by 07:00.

|
| Figure 5 Echogram showing representative fish spreading movements at night The green curves at the bottom and top are the analytical terminal and starting lines, respectively, and the region between the two lines was analyzed. Acoustic data were collected at the S3 site. a and b are the echograms during fish spreading and after spreading, respectively. |
Sv is an indicator of relative biomass density of the water column sampled using an acoustic instrument. The Sv values were outputted from Echoview software, aggregated, and averaged by time period and depth layer to show the temporal and vertical patterns of relative biomass density. The stationary survey data indicated that mean Sv increased as depth increased for any time of day (Fig. 6 and Table 8). The Wilcoxon test indicated that the difference in the Sv distribution between 4-8 and 8-12-m-depth layers was not significant (P=0.42), but significant differences were observed in the Sv distributions among the other depth layers (Table 9). Mean Sv varied more with time and depth (4-8, 8-12, 12-16, and 16-20 m) during the night (3.6, 2.7, 1.5, and 3.9 dB, respectively) than during the day.

|
| Figure 6 The 24-h periodic variation in volume backscattering strength (Sv) based on depth Acoustic data were collected at the S3 site on June 23, 2013. |

|

|
The transect survey revealed large temporal and spatial heterogeneity in the Sv distributions (Fig. 7). Spatial variation (SV) of Sv at 07:00-10:00 and 13:00-16:00 (day) was much greater (1.8 and 1.6 dB, respectively) than at 18:00-21:00 and 21:00-24:00 (night), but mean Sv at night was much greater (2.1 dB) than during the day (t-test, P < 0.01).

|
| Figure 7 Volume backscattering strength (Sv) (dB) distributions for the different survey time periods Acoustic data were collected on June 21. The analysis block was defined as a distance of 200 m to calculate mean Sv. |
The spatial distributions of the “average TS” values from the transect survey indicated temporal and spatial heterogeneity (Fig. 8). The “mean (±SD)” values of the “average TS” during 07:00-10:00, 13:00-16:00, 18:00-21:00, and 21:00-24:00 were -60.71±4.80, -54.72±7.40, -58.85±4.88, and -54.90±3.0, respectively. The differences in the “average TS” distributions from the transect survey data were not significant for 07:00-10:00 vs. 13:00−16:00 (P=0.107), 07:00−10:00 vs. 18:00−21:00 (P=0.118) and 13:00−16:00 vs. 18:00−21:00 (P=0.909) (Wilcoxon test), but the differences were significant for 13:00−16:00 vs. 21:00−24:00 (P < 0.01), 13:00−16:00 vs. 21:00−24:00 (P < 0.05), and 18:00−21:00 vs. 21:00−24:00 (P < 0.01).

|
| Figure 8 “Average target strength (TS) (dB)” of the single-target detections along the transects at different survey times Acoustic data were collected on June 21. The analysis block was defined as 200 m to calculate “average TS”. |
Fish densities (mean±SD) obtained using the echo counting method were significantly different (one-way analysis of variance [ANOVA], P < 0.01) between day (07:00-10:00 and 13:00-16:00: 0.017±0.002 and 0.018±0.003 inds./m3, respectively) and night (18:00- 21:00 and 21:00-24:00: 0.032±0.009 and 0.032±0.006 inds./m3) (Fig. 9). Similarly, fish densities obtained using the echo integration method at 07:00- 10:00 and 13:00-16:00 were 0.012±0.004 and 0.016±0.007 inds./m3, respectively, and were 0.028±0.008 and 0.031±0.012 inds./m3 at 18:00- 21:00 and 21:00-24:00, respectively (Fig. 10). The day and night fish densities were significantly different (one-way ANOVA, P < 0.01). The difference in the fish density distributions estimated using the echo counting and echo integration methods from the transect survey data at 07:00-10:00 was significant (t-test, P=0.000), but the differences at 13:00-16:00 (P=0.155), 18:00-21:00 (P=0.053), and 21:00-24:00 were not significant (P=0.894).

|
| Figure 9 Fish density distributions at different survey times using the echo counting method |

|
| Figure 10 Fish density distributions at different survey times using the echo integration method |
This study used a combination of acoustic and traditional sampling methods to add valuable information on community structure, abundance, size, and spatial and temporal distributions of coral reef fish in the South China Sea. Despite the large number of studies in this region, little is known about the fish community on Zhubi Reef. Prior to the present study, only Li et al. (2003) had carried out two survey cruises in the waters around Zhubi Reef in April 1998 and May 1999 using gill nets and hand-lines. No fish samples were obtained on the first cruise. Hand-line fishing (working depth: 10-20 m) and two gill net sets (duration: 2 h, working depth: 2-20 m) were conducted for 3 h during the day of cruise No. 2. In total, 76 fish were captured (total weight, 6.8 kg), Epinephelus merras was the most abundant species (85.5%) in their survey, and all fish were captured by hand-line. In our study, the most abundant species was P. caninus (29.4%, Table 6), which were collected mostly by hand-line. Fish composition and species diversity in our survey were much higher than those of Li et al. (2003), which may have been due to differences in sampling intensity, time frame, and surveying date.
Another study (Chen et al., 2007) on an adjacent reef suggested that Lutjanidae was the most common family, followed by Carangidae and Acanthuridae. In contrast, our results suggest that Pomacentridae was dominant on Zhubi Reef (six species) followed by Labridae (four species), and Lutjanidae and Mullidae (two species each). Thus, species composition and community structure appeared to differ even among adjacent coral reef ecosystems, which might partially explain why the South China Sea is one of the world’s biodiversity centers. However, many factors, such as sampling, tide, and bottom substrate structure, can affect these differences (Sale and Dybdahl, 1978; Sale and Douglas, 1984; Wu et al., 2001; Chen et al., 2007; Shi et al., 2009).
Our results indicate that fish primarily occupied the benthic region of the Zhubi Reef water column during the day and moved to the mid and upper regions at night. Furthermore, mean fish density during the night was about twice that during the day. Why fish were far more abundant at night than during the day is an interesting phenomenon. Zhubi Reef is located far from the mainland and experiences little change in temperature or salinity; hence, these factors do not explain the changes in fish spatial distribution. The nearest reef is the Zhongye Islands about 15 km away; thus, it is impossible to immigrate or emigrate between them. Therefore, there must be some other reason for the discrepancies in fish density between day and night. Here, we offer three possible reasons. First, fish may occupy different habitats (reef flat, reef slope, or lagoon) during the day than at night (Luo et al., 2009). Second, the fish are near the bottom during the day, hiding among the coral, and come out to feed at night (Allen and Erdmann, 2012). Third, fish form schools during the day, and schools can avoid the survey vessel by detecting shadows and noise from the vessel (MacLennan and Simmonds, 1992).
In reality, it is most likely a combination of these three explanations and different behaviors, such as feeding, spawning, and predator avoidance, that contributed to the difference. Fish residing in waters around the coral reef could come into the reef region for feeding at night and then leave during the day. Yin et al. (2011) reported that zooplankton species richness and mean abundance on Zhubi Reef are 4.6 and 46.2 times higher, respectively, during the night than during the day. Considering that many fish species in the coral reef community are planktivores (Heidelberg et al., 2004), and that spatial distribution and diel vertical movement of fish and zooplankton on Zhubi Reef are consistent, the distribution and movement of fish could be associated with their feeding behavior. Further detailed studies on coral reef fish movement, distribution, and behavior using underwater cameras (Luo et al., 2009) and acoustic tags (Bolden, 2000) are needed.
Our study was conducted over 2 consecutive days and encompassed the complete tidal cycle (low and high tides) that occurred during day and night. We did not find any changes in fish spatial distribution, pattern of downward movement during the day, or upward movement at night related to tidal phase, suggesting that daily tidal changes do not affect the spatial distribution or diel vertical movement of fish on Zhubi Reef. However, as our study was conducted only near the full moon (June 23), we were unable to address whether differences in movement, distribution, or behavior of Zhubi Reef fish are related to the lunar phase, as most reef fish spawn during the full or new moon phase (Sale, 1980).
Our acoustic data indicate that very small fish were the largest group on Zhubi Reef. However, we were unable to physically sample these fish because of gear limitations, but large numbers of~5 cm (total length) individuals were observed based on acoustic TS. The distributions of the numbers of very small, smallsized, medium, large-sized, and very large fish resembled a pyramid, with the smaller species at the base. The very small and small-sized fish contributed significantly to abundance and species richness on this coral reef.
Our findings are similar to those reported by Fabi and Sala (2002). They assessed biomass and diel activity of fish inhabiting the Senigallia artificial reef using a stationary hydroacoustic system with two bottom-mounted and up-looking and one mid-water side-looking Simrad EY500 transducer. They concluded that the lowest densities were generally recorded in the early afternoon and that the highest abundances were commonly observed late at night and early in the morning; moreover, the fish assemblage did not appear to be homogeneously distributed inside the reef.
Dual-beam and split-beam systems are designed to detect individual fish far enough from neighbors to avoid overlapping echoes (Foote, 1996). The overlapping echoes of two fish may be falsely detected as a single target when the echo counting method is used, which may result in a lower fish density than the actual value and could be a significant source of error (Soule et al., 1997). The calculated fish density can be less than the actual value when using the echo integration method because of under-sampling of small fish (MacLennan and Simmons, 1992). These errors may cause discrepancies between fish density values estimated using the echo integration and echo counting methods (Simmons and MacLennan, 2005).
Sale et al. (1978) reported that species on isolated coral heads at lagoon and reef slope sites discriminate among different types of habitats but to different degrees at different sites. Li et al. (2003) found that both catch rate and catch per unit effort (CPUE) by gill netting coral reef fish on a reef flat are higher than those observed in shallow and deep areas of the reef margin in the center and north waters of the Nansha Islands. Sun et al. (2005) reported that catch rate and CPUE of bottom gill netting for coral reef fish on the reef slope are 1.43 and 0.82 times that in the reef lagoon at the Zhongsha Islands. The relationship between coral reef status and fish distribution may be important, particularly in different reef zones, such as the slope and lagoon. Hydroacoustic methods are very helpful to investigate differences in fish distributions in different reef zones. Unfortunately, we only carried out the acoustic survey in the lagoon. In the future, we will design new and detailed hydroacoustic surveys to investigate the relationships between coral reef status and fish distributions on the slope and lagoon of the coral reef.
5 CONCLUSIONThe combination of traditional fish sampling methods (hand-line and gill net) with modern hydroacoustic techniques helped us investigate fish community structure, distribution, and diel movements on Zhubi Reef. We collected 126 individuals belonging to 29 species, 20 genera, 17 families, three orders, and two classes using traditional gear. Perciforms were the dominant group in terms of species richness and biomass. The acoustic data indicated that very small and small fish contributed substantially to abundance and species richness on the coral reef, and that the proportions of medium-sized and large-sized fish increased gradually as depth increased, whereas very large fish ( > -35 dB) were distributed entirely below 15 m. The single-target detection method revealed two distinct size classes in the 12-16 and 16-20-m-depth layers during the day; one group was very small-sized fish (TS < 60 dB), and the other consisted of medium and large-sized fish (TS > -55 dB). The TS distributions in the different depth layers were unimodal at night. Diel vertical movement of fish was evidenced as spread and upward movement just before sunset, and they assembled and descended shortly (15 min) after sunrise. Data collected using the echo integration method indicated that mean Sv increased as depth increased, and that mean Sv at night was much greater than that during the day. Data collected using the echo counting method revealed mean densities of 0.012, 0.016, 0.028, and 0.031 inds./m3 for the 07:00−10:00, 13:00−16:00, 18:00−21:00, and 21:00−24:00 time periods, respectively, and the data collected using the echo integration method produced similar densities of 0.017, 0.018, 0.032, and 0.032 inds./m3 for the same time periods.
ACKNOWLEDGMENT: We are very thankful to the reviewers for their helpful and constructive comments. Additionally, we thank Professors LIANG Peiwen and ZHONG Zhihui for identifying some of the fish species| Allen G R, Erdmann M V. 2012. Reef Fishes of the East Indies:volumes I-Ⅲ, Tropical Reef Research. University of Hawai'i Press, Perth, Australia. |
| Anderson C I H, Brierley A S, Armstrong F, 2005. Spatiotemporal variability in the distribution of epi-and mesopelagic acoustic backscatter in the Irminger Sea, North Atlantic, with implications for predation on Calanus finmarchicus. Marine Biology, 146 (6) : 1177 –1188. Doi: 10.1007/s00227-004-1510-8 |
| Bellwood D R, Hughes T P, Folke C, Nyström M, 2004. Confronting the coral reef crisis. Nature, 429 (6994) : 827 –833. Doi: 10.1038/nature02691 |
| Bolden S K, 2000. Long-distance movement of a Nassau grouper (Epinephelus striatus) to a spawning aggregation in the central Bahamas. Fishery Bulletin, 98 (3) : 642 –645. |
| Chen G B, Li Y Z, Chen P M, Zhang J, Fang L C, Li N N, 2012. Measurement of single-fish target strength in the South China Sea. Chinese Journal of Oceanology and Limnology, 30 (4) : 554 –562. Doi: 10.1007/s00343-012-1218-4 |
| Chen G B, Li Y Z, Chen X J, 2007. Species diversity of fishes in the coral reefs of South China Sea. Biodiversity Science, 15 (4) : 373 –381. Doi: 10.1360/biodiv.060268 |
| Chen G B, Li Y Z, 2005. Composition and distribution of Serranidae in main coral reef waters of South China Sea. South China Fisheries Science, 1 (3) : 18 –25. |
| Chen Q C, 1997. Current status and prospects of marine biodiversity in China. Chinese Biodiversity, 5 (2) : 142 –146. |
| Fabi G, Sala A, 2002. An assessment of biomass and diel activity of fish at an artificial reef (Adriatic Sea) using a stationary hydroacoustic technique. ICES Journal of Marine Science, 59 (2) : 411 –420. Doi: 10.1006/jmsc.2001.1173 |
| Foote K G, Knudsen H P, Vestnes G, MacLennan D N, Simmonds E J. 1987. Calibration of acoustic instruments for fish density estimation:a practical guide. International Council for the Exploration of the Sea Cooperative Research Report, No. 144. p.1-57. |
| Foote K G, 1980. Importance of the swimbladder in acoustic scattering by fish:a comparison of gadoid and mackerel target strengths. The Journal of the Acoustical Society of America, 67 (6) : 2084 –2089. Doi: 10.1121/1.384452 |
| Foote K G, 1987. Fish target strengths for use in echo integrator surveys. The Journal of the Acoustical Society of America, 82 (3) : 981 –987. Doi: 10.1121/1.395298 |
| Foote K G, 1996. Coincidence echo statistics. The Journal of the Acoustical Society of America, 99 (1) : 266 –271. Doi: 10.1121/1.414537 |
| Gledhill C T, Lyczkowski-Shultz J L, Rademacher K, Kargard E, Crist G, Grace M A, 1996. Evaluation of video and acoustic index methods for assessing reef-fish populations. ICES Journal of Marine Science, 53 (2) : 483 –485. Doi: 10.1006/jmsc.1996.0069 |
| Harris P T, Bridge T C L, Beaman R J, Webster J M, Nichol S L, Brooke B P, 2013. Submerged banks in the Great Barrier Reef, Australia, greatly increase available coral reef habitat. ICES Journal of Marine Science, 70 (2) : 284 –293. Doi: 10.1093/icesjms/fss165 |
| Heidelberg K B, Sebens K P, Purcell J E, 2004. Composition and sources of near reef zooplankton on a Jamaican forereef along with implications for coral feeding. Coral Reefs, 23 (2) : 263 –276. |
| Higginbottom I, Woon S, Schneider P. 2008. Echoview Technical Manual-Hydroacoustic Data Processing for Standard Stock Assessment Using Echoview. Myriax software Pty Ltd publication, Hobart. |
| Huse I, Ona E, 1996. Tilt angle distribution and swimming speed of overwintering Norwegian spring spawning herring. ICES Journal of Marine Science, 53 (5) : 863 –873. Doi: 10.1006/jmsc.1996.9999 |
| Koslow J A, 2009. The role of acoustics in ecosystem-based fishery management. ICES Journal of Marine Science, 66 (6) : 966 –973. Doi: 10.1093/icesjms/fsp082 |
| Lan Z H, Chen G Z, 2006. Destruction and conservation countermeasures of coral reef in South China Sea. Ecology and Environment, 15 (2) : 430 –434. |
| Li Y Z, Jia X P, Chen G B, Chen P M, Shu L M, Zeng X G. 2007. The South China Sea Coral Reef Fish Resources.China Ocean Press, Beijing, China. (in Chinese) |
| Li Y Z, Lin Z J, Chen P M, Sun D R, Chen Y, Chen G B, Zhang X F, 2003. Survey for coral reef fish resources in the center & north waters of the Nansha Islands. Journal of Fisheries of China, 27 (4) : 315 –321. |
| Lu W D. 2010. SPSS Statistics Analysis. 4th edn. Publishing House of Electronics Industry, Beijing, China. (in Chinese) |
| Luo J G, Serafy J E, Sponaugle S, Teare P B, Kieckbusch D, 2009. Movement of gray snapper Lutjanus griseus among subtropical seagrass, mangrove, and coral reef habitats. Inter-Research Marine Ecology Progress Series, 380 (12) : 255 –269. |
| MacLennan D N, Simmonds E J. 1992. Fisheries Acoustics.Chapman & Hall, New York. |
| Mason D M, Simmonds T B, Harvey C J, Kitchell J F, Schram S T, Bronte C R, Hoff M H, Lozano S J, Trebitz A S, Schreiner D R, Lamon E C, Hrabik T, 2005. Hydroacoustic estimates of abundance and spatial distribution of pelagic prey fishes in western Lake Superior. Journal of Great Lakes Research, 31 (4) : 426 –438. Doi: 10.1016/S0380-1330(05)70274-4 |
| Melbourne-Thomas J, Johnson C R, Aliño P M, Geronimo R C, Villanoy C L, Gurney G G, 2011. A multi-scale biophysical model to inform regional management of coral reefs in the western Philippines and South China Sea. Environmental Modelling & Software, 26 (1) : 66 –82. |
| Midttun L, Sætersdal G, 1957. On the Use of Echosounder Observations for Estimating Fish Abundance. Special Publication, International Commission for the Northwest Atlantic Fisheries, 11 : 260 –266. |
| Mitson R B, Simard Y, Goss C, 1996. Use of a two-frequency algorithm to determine size and abundance of plankton in three widely spaced locations. ICES Journal of Marine Science, 53 (2) : 209 –215. Doi: 10.1006/jmsc.1996.0024 |
| Ng P K L, Tan K S, 2000. The state of marine biodiversity in the South China Sea. The Raffles Bulletin of Zoology (8) : 3 –7. |
| Nyström M, Folke C, Moberg F, 2000. Coral reef disturbance and resilience in a human-dominated environment. Trends in Ecology & Evolution, 15 (10) : 413 –417. |
| Pandolfi J M, Bradbury R H, Sala E, Hughes T P, Bjorndal K A, Cooke R G, McArdle D, McClenachan L, Newman M J H, Paredes G, Warner R R, Jackson J B C, 2003. Global trajectories of the long-term decline of coral reef ecosystems. Science Magazine, 301 (5635) : 955 –958. |
| Polovina J J, 1984. Model of a coral reef ecosystem. Coral Reefs, 3 (1) : 1 –11. Doi: 10.1007/BF00306135 |
| Rudstam L G, Parker S L, Einhouse D W, Witzel L D, Warner D M, Stritzel J L, Parrish D L, Sullivan P J, 2003. Application of in situ target-strength estimations in lakes:examples from rainbow-smelt surveys in Lakes Erie and Champlain. ICES Journal of Marine Science, 60 (3) : 500 –507. Doi: 10.1016/S1054-3139(03)00046-8 |
| Sale P F, Douglas W A, 1984. Temporal variability in the community structure of fish on coral patch reefs and the relation of community structure to reef structure. Ecology, 65 (2) : 409 –422. Doi: 10.2307/1941404 |
| Sale P F, Dybdahl R, 1978. Determinants of community structure for coral reef fishes in isolated coral heads at lagoonal and reef slope sites. Oecologia, 34 (1) : 57 –74. Doi: 10.1007/BF00346241 |
| Sale P F, 1980. The ecology of fishes on coral reefs. Oceanography and Marine Biology-An Annual Review, 18 : 367 –421. |
| Shi Y R, Li Y Z, Lu W H, Sun D F, 2009. Taxonomic diversity of fish species in coral reef area from Dongsha Islands. South China Fisheries Science, 5 (2) : 10 –16. |
| Simmonds E J, MacLennan D N. 2005. Fisheries Acoustics:Theory and Practice. 2nd edn. Blackwell Scientific Publication, Oxford. |
| Simrad. 2008. Simrad ER60, Scientific Echo Sounder Software, Reference Manual. Simrad Maritime AS Kongsberg, Horten. p.19-31. |
| Soule M, Barange M, Solli H, Hampton I, 1997. Performance of a new phase algorithm for discriminating between single and overlapping echoes in a split-beam echosounder. ICES Journal of Marine Science, 54 (5) : 934 –938. Doi: 10.1006/jmsc.1997.0270 |
| Sun D R, Lin Z J, Qiu Y S, Wang X H, 2005. Fish fauna of coral reef waters of the Xisha Islands. South China Fisheries Science, 1 (5) : 18 –25. |
| Trout G C, Lee A J, Richardson I D, Harden Jones F R, 1952. Recent echo sounder studies. Nature, 170 (4315) : 71 –72. |
| UNEP. 2004. Coral Reef in the South China Sea. UNEP Press, Bangkok. |
| Wang X H, Du F Y, Lin Z J, Sun D R, Qiu Y S, Huang S L, 2011. Fish species diversity and community pattern in coral reefs of the Xisha Islands, South China Sea. Biodiversity Science, 19 (4) : 463 –469. Doi: 10.3724/SP.J.1003.2011.07267 |
| Wu L X, Wang H K, Lin H Y, Chen Q C, 2001. Physical and chemical environment characteristics of Zhubi Coral Reef in southern South China Sea. Journal of Tropical Oceanography, 20 (3) : 1 –7. |
| Yin J Q, Huang L M, Li K Z, Xiong L L, 2011. Species diversity and community structure of zooplankton in the Zhubi Atoll, Nansha Islands, South China Sea. Biodiversity Science, 19 (6) : 685 –695. |
| Zhang J, Chen P M, Chen G B, Fang L C, Tang Y, 2013. Acoustic target strength measurement of banded grouper. Journal of Applied Ichthyology, 29 (6) : 1453 –1455. Doi: 10.1111/jai.2013.29.issue-6 |
| Zhao M X, Yu K F, Zhang Q M, Shi Q, Price G J, 2012. Longterm decline of a fringing coral reef in the northern South China Sea. Journal of Coastal Research, 28 (5) : 1088 –1099. |
| Zhao X Y, Chen Y Z, Li X S, Sun J M, Jin X S, Chen W Z, Li Y Z, 2003. Acoustic estimation of multi-species marine fishery resources. Acta Oceanologica Sinica, 25 (S1) : 192 –202. |
| Zhao X Y, Wang Y, Dai F Q, 2006. Depth-dependent target strength of anchovy (Engraulis japonicus) measured in situ. ICES Journal of Marine Science, 65 (5) : 882 –888. |
| Zwolinski J, Morais A, Marques V, Stratoudakis Y, Fernandes P G, 2007. Diel variation in the vertical distribution and schooling behaviour of sardine (Sardina pilchardus) off Portugal. ICES Journal of Marine Science, 64 (5) : 963 –972. Doi: 10.1093/icesjms/fsm075 |