 2023, Vol. 41
Institute of Oceanology, Chinese Academy of Sciences
Article Information
- WANG Zhaohua, ZHAO Dongliang, WU Kejian, XIE Lian
- Influence of Qinghai-Xizang Plateau snow cover on interannual variability of Western North Pacific tropical cyclone tracks
- Journal of Oceanology and Limnology, 41(6): 2060-2076
- http://dx.doi.org/10.1007/s00343-023-2358-4
Article History
- Received Nov. 3, 2022
- accepted in principle Nov. 28, 2022
- accepted for publication Dec. 13, 2022


2 Department of Marine, Earth and Atmospheric Sciences, North Carolina State University, Box 8208, Raleigh, NC 27695, USA
As one of the deadliest natural disasters on the Earth, tropical cyclone (TC) often cause significant loss of lives and massive damages to property and natural environment due to strong winds, heavy rain, and tidal surges (Xie et al., 2005a; Zhang et al., 2009; Sun et al., 2019; Cai et al., 2022; Xiang et al., 2022). Among all ocean basins, the Western North Pacific (WNP) has the largest TCs number, accounting for more than 1/3 of all TCs in the world (Wu and Wang, 2004; Webster et al., 2005; Peduzzi et al., 2012; Mei and Xie, 2016; Zhan et al., 2016; Dai et al., 2022; Song et al., 2023). The number of WNP TCs varies annually between 17 (1951) and 43 (1996) from 1950 to 2018, with an average of 28.4. The maximum landfall number in coastal areas of China is 15 (1952, 1961), with an annual average of 9. At least 4 TCs made landfall (1982) annually during the study period, and most of them formed in the Western Pacific Ocean south of 20°N and west of 160°E. The typhoon season (the maximum wind speed near the center is greater than 64 kt) in the WNP generally starts from April and lasts until December, and about 80% TCs are generated from June to October (peak period). Most TCs move to the west and then north. The number of TCs and their track patterns have obvious inter-annual and seasonal variation. The TCs landfall locations are closely related to their track patterns.
The research on the inter-annual variation of the TCs landfall frequency and location has attracted great attention (Wang and Chan, 2002; Liu and Chan, 2003; Wu et al., 2006; Zhan et al., 2011; Zhang et al., 2012; Kang and Elsner, 2016; Gao et al., 2018; Zhou and Lu, 2019; Camp et al., 2020; Sparks and Toumi, 2021; Xiao, 2021). The annual frequency and intensity of TCs vary from year to year. If annual frequency increases, the threat to human and property will increase, whereas if it decreases, it may lead to water shortage and other negative impacts. Therefore, the study of inter-annual variations of TCs landfall frequency has an important social and economic significance. Moreover, it is important to understand how environmental factors affect the inter-annual variation of TC track patterns.
Previous studies have shown Qinghai-Xizang Plateau snow cover (QXPSC) could affect track patterns of TCs (Xie et al., 2005b; Xie and Yan, 2007). In the study, we focus on the effect of QXPSC on the inter-annual variation of WNP TC track patterns and landfall locations. Through statistical and composite analysis, the physical mechanism for the inter-annual variation of the TCs landfall number in coastal areas of East and South China is explored. Case studies are conducted to test the hypothesis. This study also aims to provide data support for disaster prevention and mitigation in coastal waters of China.
2 DATA AND METHODOLOGY 2.1 Study area and dataThe study area is 0°–50°N, 105°E–180°E, and the time span is 69 years (1950–2018). The total number of TCs and the best track dataset are derived from the Joint Typhoon Warning Center (JTWC). The best track data for each TC record contains the date every 6 h (00:00–18:00), the central location (longitude and latitude), the intensity (sustained maximum wind speed near the cyclone center, in knot), the near central pressure, and the number of TCs. The data of TCs landfall number and locations in coastal areas of China are obtained from the TC Data Center of China Meteorological Administration, including year, serial number, name, landfall province, landfall frequency, landfall intensity, etc. Geopotential height (GH) use the monthly average re-analysis data derived from the National Oceanic and Atmospheric Administration (NOAA) with the area (0°–40°N, 100°E–180°E) and 17 layers (1 000–10 hPa). The East Asian summer monsoon (EASM) index was derived from the National Tibetan Plateau Data Center (TPDC), which is defined by the zonal wind at 200 hPa as follows (Zhao et al., 2015):
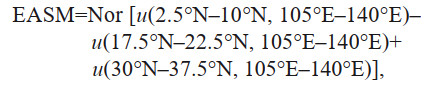
where Nor stands for normalization, and u stands for 200 hPa zonal wind field.
The QXPSC datasets use ERA5 re-analysis data of the monthly average snow cover (SC) area derived from the European Centre for Medium-Range Weather Forecasts (ECMWF) with a spatial resolution of 0.1°×0.1°. Each grid data represents the SC area, with a value ranging from 0 to 100%. Due to weather, the missing data is Nan. The selected area is 30°N–40°N and 75°E–105°E. The winds use the monthly average re-analysis data of NOAA, with 17 layers (1 000–10 hPa) and the selected area (0°–40°N, 100°E–180°E).
2.2 Principal component analysisPrincipal component analysis (PCA) is also known as empirical orthogonal function (EOF) (Lorenz, 1956), which has been widely used in meteorological and oceanographic data analysis (Anderson and Gyakum, 1989; Knappenberger and Michaels, 1993; Lee and Cornillon, 1995). Using PCA can identify a set of orthogonal functions, and characterize the time series covariability. Then, the leading EOF modes are analyzed to provide physical insights of the data and verify the significant environmental factors which may affect the cyclone track patterns.
2.3 Track density functionTCs with related environmental factors have been recorded since 1945, which provides clues to TC changes in response to climate changes. We calculate the track density function (TDF) based on historical TC track data sets (Xie et al., 2005a), which can provide information on cyclone track density field. In this study, the TDF uses a 1°×1° grid to describe the TCs track density distribution over the time scale of 10 days, rather than accurately describing a single TC track. The formula is as follows:

where xj is the typhoon position at the jth time, and tj is the time of the jth observation. Use W(Δx, Δt), a weighting function, to define the TDF spatial and temporal smoothness; Sx and St, respectively, are the spatial and temporal resolutions, are both constants. In the study, 22/π, 24/π were taken.
3 RESULT 3.1 Spatial and temporal distribution of WNP TCs TDFThere are 69 spatial EOF modes of TDF. The top 3 EOF modes of the TDF explain 66.9% of the total variance, respectively, 44.76%, 13.57%, and 8.57% (Fig. 1 & Supplementary Fig.S1). EOF1 seems to be correlated with the total TCs number and frequency in the Western Pacific Ocean basin (Fig. 1a), and EOF2 is related to the track pattern in the east-west (E-W) direction, and may also be related to the number and frequency of TCs in South China Sea (Fig. 1b). The center of 145°E–150°E shows a circular negative value area, roughly presenting a north-south (N-S) symmetric structure, so EOF3 seems to be related to the TCs track pattern in the N-S direction (Fig. 1c).

|
| Fig.1 Spatial distribution of the TDF field associated with dominant EOF modes a. spatial distribution of the TDF field associated with EOF1 (44.76%). The EOF1 occupying a dominant position was centered in the positive region with a large size of 10°N–15°N and 140°E–150°E, and decreased in an oval shape. This area is similar to the basin area where TCs are most frequently generated; b. spatial distribution of the TDF field associated with EOF2 (13.57%). The EOF2 shows an east-west symmetric structure on the whole, with a large positive region in the South China sea to the west of 130°E, and a large negative region centered at 15°N and 144°E to the east of 130°E; c. spatial distribution of the TDF field associated with EOF3 (8.57%). An oval positive area was with 5°N – 10°N, 130°E – 155°E as the center in the whole sea area south of 17°N; and 20°N–25°N as the center in the whole sea area north of 17°N. |
PCA was performed on the 1°×1° grid to obtain 69 time series (PCs) (Supplementary Fig.S2), and their coefficients (positive and negative) represent the spatial mode cycle (strong and weak).
The Monte Carlo method is reliable to obtain the statistical significance of the modal components (EOFs). Randomly assign starting data to each cyclone in the dataset and compare the residuals of dominant modes of the cyclone TDF with their corresponding data (Keith and Xie, 2009). Results indicate that the top 3 modes maintain their ranking in the spatial distribution hierarchy and show high similarity, that is, 92 matches out of 100 Monte Carlo experiments with a spatial correlation coefficient of at least 0.9, which illustrate significant statistical independence.
3.2 Correlation between the total number, landfall number and each modeEOF1 and EOF2 are positively correlated with the total number of TCs, but EOF3 shows an opposite correlation (Supplementary Fig. S3). EOF1 represents the TCs frequency in the Western Pacific Ocean basin. In TC-prone years, cyclones prefer a westward and/or northward track pattern. The number of TCs is weakly positively correlated with the landfall number (Supplementary Fig.S4a), indicating that the correlation between the cyclones number and the landfall number in the same year was not strong in coastal areas of China. To explore the relationship between the landfall number and each mode accurately, the cyclone landfall locations were divided into East China and South China. EOF1 was less associated with the landfall number in East/South China, which is corresponding to the above results (Supplementary Fig.S4b–d). EOF2 with an E-W spatial distribution pattern was positively correlated with the landfall number and the landfall number in South China, but irrelevant with the landfall number in East China (Supplementary Fig.S4e–g), which indicates that the westward track pattern would lead to an increase of landfall number in South China. EOF3 with an N-S spatial distribution pattern was significantly and negatively correlated with the landfall number in East China (Supplementary Fig.S4h–i), but unrelated with the landfall number in South China (Supplementary Fig.S4j), which means the northward track pattern would lead to an increase in the landfall number in East China.
3.3 Track patterns associated with the dominant modesIn this section, the track patterns of dominant EOFs modes with large positive (negative) coefficients are studied. Each mode is divided into Modei+ and Modei– types (i=1, 2, 3). Modei+/Modei– represent the years in which EOFi has time series with large positive/negative coefficients (greater than/less than 1/2 of the maximum coefficients), respectively. Then, the complete TC track with same number of representative Modei+ and Modei – are selected for comparison to find out the annual track patterns differences of positive and negative coefficients, which can further understand the inter-annual variation of WNP TC track patterns.
In the Mode1+ years, an average of 35.38 TCs is annually generated lasting 10.29 days on average, of which about 59.36% were intense typhoons (1 min average near center maximum wind speed greater than 64 kt), 16.25% of them developed into super typhoons (1 min average near center maximum wind speed greater than 129 kt), and 26% typhoons land in coastal areas of China (Fig. 2a). The moving trend to coastal areas of South China is low, and the track is straight northwestward or northwest to northeast curved. In the Mode1– years, TCs with an average of 23 are annually generated lasting on average 5.87 days with 36.09% landing in coastal areas of China and 54.35% of them being intense typhoons (1 min average near center maximum wind speed greater than 64 kt), and 10.87% of them developed into super typhoons (1 min average near center maximum wind speed greater than 129 kt) (Fig. 2b). The moving trend to coastal areas of South China is high, and the straight track moving to the northwest or northeast is preferred.

|
| Fig.2 Top three modes typhoon track a. Mode1+ TC track. The central region (5°N–20°N, 140°E–160°E) was the main area where the cyclone was generated. The number of TCs is large, the track is long, and the intensity is high; b. Mode1– TC track. The South China Sea to the west of 130°E, the waters near the Philippines and the waters north of 20°N were the main areas where cyclone was generated. The number of TCs is small, the track is short, and the intensity is small; c. Mode2+ TC track. The main region of cyclone generation and development is the South China Sea and the waters near the Philippines to the west of 130°E. The track is short and the intensity is small; d. Mode2– TC track. The main region of cyclone generation and development is the central WNP to the east of 130°E. The track is longer and stronger; e. Mode3+ TC track. The main region of cyclone generation and development is the southern part of the central WNP south of 10°N; f. Mode3– TC track. The main region of cyclone generation and development is the northern part of the central WNP north of 10°N. |
In the Mode2+ years, TCs with an average of 31.67 are annually generated lasting on average 6.57 days of which about 46.32% was intense typhoons (1 min average near center maximum wind speed greater than 64 kt), 10.18% of them developed into super typhoons (1 min average near center maximum wind speed greater than 129 kt), and 30.53% typhoons land in coastal areas of China (Fig. 2c). The movement tends to be straight path to the west or north. In the Mode2– years, an average of 23.67 TCs are annually generated lasting on average 7.72 days with 33.8% TCs making landfalls in coastal areas of China, 73.71% of them being intense typhoons (1 min average near center maximum wind speed greater than 64 kt), and 25.35% of them developed into super typhoons (1 min average near center maximum wind speed greater than 129 kt) (Fig. 2d). The movement tends to be in north-northeast curved path.
In the Mode3+ years, an average of 33.33 TCs are annually generated lasting on average 9.09 days with about 16.33% of them being intense typhoons (1 min average near center maximum wind speed greater than 64 kt), 12% of them developed into super typhoons (1 min average near center maximum wind speed greater than 129 kt), and 25% typhoons making landfalls in the coastal areas of China (Fig. 2e). TCs tend to move along a straight northwestward track and rarely cross 25°N. In the Mode3– years, an average of 36 TCs are annually generated lasting on average 8.37 days with 28.89% TCs land in the coastal areas of China, 53.33% of them being intense typhoons (1 min average near center maximum wind speed greater than 64 kt), and 11.1% of them developed into super typhoons (1 min average near center maximum wind speed greater than 129 kt) (Fig. 2f). TCs tend to move along the northwest-northeast curved track bounded by 50°N to the north.
3.4 Influence of QXPSC on cyclone track pattern and landfall locationQXPSC is closely related to the mid-latitude atmospheric circulation, EASM and other circulation systems. Studying the correlation between EASM and the dominant TDF EOFs is useful for explaining the role of EASM in WNP TC activities and is also supportive for exploring the weight order of EASM and QXPSC in the moderation of WNP TC activities. Meanwhile, examine the relationship between EASM and QXPSC can better determine which environmental factors dominate the inter-annual variation of the WNP TCs number, landfall locations, and track patterns in the process of East Asian atmospheric circulation.
Further correlation analysis of QXPSC and TC track patterns reveals that Mode1 has a negative correlation center in the 34°N–36°N, 80°E–82°E (Fig. 3a); Mode2 has 2 positive correlation centers in the northwest and southeast regions and 2 negative correlation centers in the southwest and central regions (Fig. 3b). Mode3 has 1 positive correlation center in the western region and 1 negative correlation center in the eastern region (Fig. 3c). There is a central region of negative correlation between the total TC generation and QXPSC in the western region and a central region of positive correlation in the WNP eastern region, and the overall distribution pattern is similar to that of the EOF1 (Fig. 4), which validates the findings that EOF1 represents the total WNP TC generation. There is a good correlation between the landfall number in East/South China and QXPSC (Fig. 5 & Supplementary Figs.S5–S6), which indicates that the inter-annual variation in the WNP TC number, the landfall number and the track pattern were influenced by QXPSC.

|
| Fig.3 Correlation between QXPSC and main modes a. correlation between QXPSC and Mode1; b. correlation between QXPSC and Mode2; c. correlation between QXPSC and Mode3. |

|
| Fig.4 Correlation between QXPSC and generated number |

|
| Fig.5 Correlation between landfall number in East/South China and QXPSC a. correlation between landfall number in East China and QXPSC; b. correlation between landfall number in South China and QXPSC. |
EASM has no significant correlation with the E-W track pattern (Supplementary Fig.S7). Combined with the fact that the eastern WNP is in the control area of the TCs all the year round, this result is in line with the actual situation, and the EASM shows a southwest prevailing wind state, forming a convergence area with the eastern western Pacific TW near the continent, promoting TCs development in the N-S direction. The results in Supplementary Fig. S8 are consistent with the correlation between the landfall number in East China and the N-S track pattern (EOF3). The lack of correlation between the EASM and the cyclone E-W track pattern (EOF2) also corresponds to the result that the TCs landfall number in South China is not correlated. Studies have shown that EASM is greatly affected by QXPSC (Xie and Yan, 2007). So, EASM may not be considered as an independent environmental factor affecting TC activity. Results show that the SC area in some regions is significantly and positively correlated with EASM index (Fig. 6 & Supplementary Fig.S9), indicating that QXPSC has a significant impact on EASM. EASM is a complex climate system, and the relationship between EASM and QXPSC is very complex. The atmospheric circulation over and around QXP is an important part of the system. Therefore, EASM can be considered as a link connecting QXPSC and other environmental factors with the WNP TC activities via TDF EOF3 (Xie et al., 2005b).

|
| Fig.6 Correlation between QXPSC and EASM index Use 40 years (1979-2018) of QXPSC monthly average data from January to March. A strong positive correlation region is shown in the range of 32°N–34°N, 84°E–90°E. |
In order to illustrate the inter-annual variation of TC track patterns and landfall number in East and South China, the years were selected by classifying the years of Modei+ and Modei– (Supplementary Tables S1–S3), and count the landfall number in East and South China. According to the statistical analysis, there is a significant difference on the landfall number in East and South China of Mode2+, Mode3+ and Mode2–, Mode3–, while the difference in the Mode1 is not significant. So, the environmental and physical fields corresponding to Mode2 and Mode3 years (Supplementary Tables S2–S3), which are closely related to the cyclone track patterns in the statistical analysis, were further selected for composite and comparative analysis to better understand the physical mechanisms behind the statistical correlations.
Mode2+ has an anomalously low snow center near 30°N–32°N (Fig. 7a). A widespread rising air anomaly occurs east of 100°E in June and a stable channel of updraft anomalies between 100°E and 120°E from July to September (Fig. 8). Due to the updraft anomaly, the center of 5 900 high pressure appears near 165°E in June, the subtropical high pressure extends near 120°E in July, and the ridge of subtropical high pressure remains stable between 120°E and 140°E from July to September (Fig. 9). TC generally moves along the lateral boundary of the subtropical high pressure, which is a good indication that in years above Mode2, TC moves westward and lands more in South China. Mode2– has a slightly high snow anomaly centered at 92°E between 30°N and 32°N (Fig. 7a). The updraft and downdraft anomalies alternate from June to September, and there is not a stable updraft anomaly channel (Fig. 8). The subtropical high pressure only appears east of 135°E in July and never crosses 135°E to extend westward from July to September (Fig. 9). This corresponds to the easterly TC track pattern and the low landfall number in South China in Mode2– year.

|
| Fig.7 Composite distribution of QXPSC anomalies with positive and negative coefficients in dominant modes (January–March) a. composite distribution of QXPSC anomalies with positive and negative coefficients in Mode2+ (left)/Mode2– (right) (January–March). The QXPSC area average data from January–March in 1964, 1995, 2017, 1955, 1969, and 1997; b. composite distribution of QXPSC anomalies with positive and negative coefficients in Mode3+ (left)/Mode3– (right) (January–March). The QXPSC area average data cover January–March in 1966, 1967, 1978, 1979, 1993, and 1995. |

|
| Fig.8 Abnormal field of zonal vertical circulation composited by Mode2 with positive and negative coefficients at 30°N per year (average for June, July, and July–September) Arrows are circulation directions, and color indicates positive and negative anomalies. |

|
| Fig.9 Annual isopotential height composite field of positive and negative coefficients of Mode2 (June–September) |
Mode3+ has an anomalous low-snow center near 30°N–32°N (Fig. 7b), and a widespread rising air anomaly began in June east of 100°E and continued through September (Fig. 10). Because of this large rising air anomaly, the ridge of subtropical high pressure extended to near 110°E and 16°N in June, where it hovered from June to July, and the southern part of the subtropical high remained south of 22°N from June to September (Fig. 11). This explains the southerly TC track pattern and the low landfall number is in East China in Mode3+ years. Mode3– has a region of anomalous high snow center near 30°N–32°N (Fig. 7b). The sinking motion anomaly dominates in June, with an updraft anomaly channel near 140°E in July, and from July to September there is always a sinking motion anomaly between 100°E and 120°E and an updraft anomaly between 120°E and 140°E (Fig. 10). The subtropical high pressure appeared east of 140°E and north of 20°N in June, and the subtropical ridge receded to the northeast near 150°E and 32°N in July, and always hovered there from July to September, unable to cross 150°E and 32°N to extend west and south (Fig. 11). This corresponds to the northward tropical cyclone path pattern and the high number of landfalls in East China in Mode3– years.

|
| Fig.10 Abnormal field of zonal vertical circulation composited by Mode3 with positive and negative coefficients at 30°N per year (average for June, July, and July–September) Arrows are circulation directions, and color indicates positive and negative anomalies. |

|
| Fig.11 Annual isopotential height composited field of positive and negative coefficients of Mode3 (June–September) |
Combining the above results, in high snow years, the Qinghai-Xizang Plateau (QXP) snowmelt becomes slower in summer. The QXP acts as a heat absorber, and the sinking airflow near the plateau dominates for a long time, weakening the strength and range of the subtropical high pressure system and delaying its appearance, thus making the TC tracks more preferable to the northwest-northeast curved type, and a high landfall number in East China. In low snow years, the snowmelt becomes faster in summer. The QXP acts as a heat source with long-term dominance of updrafts close to the plateau, which leads to the westward and southward expansion of the subtropical high pressure system in the mid-latitudes and advances the time of its appearance, resulting in a TC tracks preference to the west and north in a straight pattern and a high landfall number in South China.
Thus, it can be seen that the QXP high (low) snow significantly changes the atmospheric circulation in East Asia through the interaction with the surrounding atmosphere, which in turn affects the TC track pattern and landfall location.
3.6 Case analysisIn this study, accumulated cyclone energy (ACE), as a measure of TC intensity, is the sum of the squares of the maximum observed central wind speed (maximum central wind speed of 34 kt) every 6 h in TCs above tropical storm intensity (Bell et al., 1999; Bell and Chelliah, 2006). That is, the sum of squares is calculated for the maximum observed wind speed greater than or equal to 34 kt. The formula is as follows.
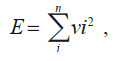
where n denotes the total TC number of observations with wind speeds greater than or equal to 34 kt during the specified observation period, i is the number of observations, and v is the observed wind speed in kt.
The TC number and landfall number in 2004 and 2017 were about the same, but the generation location, generation time, ACE, track pattern, and landfall location were all quite different (Supplementary Fig.S10 & Table S4). So, comparative analysis of QXPSC in the two years was conducted to validate the conclusions in the composite analysis discussed in Section 3.5.
As shown in Fig. 12, in 2004, one of the January–March QXP high snow cover anomalies roughly centered in the eastern region of 30°N–32°N and another was located to the north (Fig. 12a). A January–March QXP slightly low snow region was in the eastern of 30°N–32°N, and most of the entire plateau region was in line with the multi-year average at 2017 (Fig. 12b). In addition, the EASM was in the dry phase in both years (-1.36, -0.29), but the EASM in 2004 was weaker than in 2017. The sinking air anomaly was dominant in June 2004, and there was no stable updraft anomaly in all of July, and an intermittent updraft anomaly existed between 100°E and 120°E from July to September. A widespread updraft anomaly was in east of 100°E in June 2017, and a stable updraft anomaly channel between 100°E and 140°E from July to September. The anomalous channel of updraft (Fig. 13).

|
| Fig.12 Average SC anomalies from January to March in 2004 and 2017 a. average SC anomalies from January to March in 2004; b. average SC anomalies from January to March in 2017. |

|
| Fig.13 Abnormal fields of 30°N zonal vertical circulation in 2004 and 2017 (average in June, July, and July–September) Arrows are circulation directions, and color indicates positive and negative anomalies. |
In May 2004, the 5 880 Geopotential height (GHT) appeared in the region of 10°N–30°N, 130°E–160°E, and the high center kept moving northeastward, reaching north of 25°N when the ridge line extended westward to the sea east of East China, then it was cut off in September, and part of it was over Mainland area of China, and the other part continued to follow the high center located in the sea southeast of Japan centered at 30°N, after which it started to move southeastward in October, and the two boundary were located north of 20°N to the west of 120°E and east of 130°E (East China) (Fig. 14a). In May 2017, the 5 880 GHT appeared throughout the WNP Ocean south of Taiwan Island and southern China, in June the ridge had extended to Hainan, reaching 10°N to the south and 110°E to the west, and split into two in July, one centered in eastern China and one continuing to move northeast, while the ridge of subtropical high pressure crossed eastern China extending to the mainland, with the southern boundary located near Hainan Island. In September, the two highs were joined together and the ridge extended westward to 100°E westward until October (Fig. 14b), with the southern boundary of subtropical high pressure hovering near Vietnam, Hainan and Guangdong of China.

|
| Fig.14 GH distribution map from May to October in 2004 and 2017 a. GH distribution map from May to October in 2004; b. GH distribution map from May to October in 2017. |
We find that the total TC number has a good correlation with TDF EOFs. The proportion of the total WNP TCs number and most TCs prefer the northwest track pattern can reasonably correspond to the actual observation situation. The correlation between EOFs and inter-annual landfall number in coastal areas of China indicates different track pattern has a certain influence on the TC landfall location, but there is no direct relationship between the cyclone number and the landfall number (Supplementary Table S5). What's more, about 90% Mode1+ TCs were generated in the central area (5°N–30°N, 130°E–160°E). Compared with Mode1– type cyclones, they were more numerous, longer lived, stronger, and more varied in moving track, covering in overall all the WNP TC track patterns. About 90% Mode1– TCs are generated in the southwest part of the study area (South China Sea and near Philippines waters), generally moving a short distance and having a small curve. The Mode1– type TCs prefer to a straight track pattern to the west and north. The Mode1+ and Mode1– types represent the cyclone track patterns generated in the western Pacific basin, the South China Sea and the waters around the Philippines, respectively, and cover largely all types of WNP TC track patterns. Most Mode2+ TCs track to the west of 130°E and prefer to move along the coastal areas of China, while most Mode2– TCs track to the sea to the east of 130°E. The Mode2 is related to the east-west track pattern and the typhoon landfall number in South China increases when the westward track increases. The Mode3+ TCs track is mainly distributed in the southern sea of the study area, and most will not cross 25°N, preferring the northwest track. The Mode3– TCs track is mainly distributed in the north-central WNP north of 20°N, preferring the north-northwest curved track. Mode3 is related to the south-north track and the landfall number in East China increases when the northward track increases. The overall distribution of the correlation between the landfall number in East China and South China and QXPSC is similar to the results of EOF3 and EOF2, respectively, which corresponds to the results in Section 3.3.
For the case studies, 2004 was a year of QXP high snow area; the sinking long-term airflow dominated the vertical circulation; the 5 880 GHT boundary appeared in the region of 10°N–30°N, 130°E–160°E, and hovered in the northwestern region of the WNP Ocean (north of 20°N near Japan). The TC track is more easterly, and the landfall number in East China is much higher than the average. QXPSC was relatively small in 2017; updrafts dominated the vertical circulation early; the overall position of the WNP subtropical high pressure system was southwestward, with the southern boundary of the 5 880 GHT appearing in the entire WNP Ocean south of 20°N in May, after which the southern boundary of the 5 880 GHT has been hovering near Vietnam, Hainan and Guangdong of China. The TC track is more southerly, and the landfall number in South China is much higher than the average. In summary, it can be seen that the response of QXPSC to interannual variation of TC track patterns maintains a high degree of consistency with the response mechanisms summarized in Section 3.4. The comparative analysis also shows that ACE is related to the interannual variation of TC track patterns. When TCs prefer longer track patterns (such as the northwest to northeast curved pattern), they tend to have longer life with higher ACE.
To summarize, as shown in Fig. 15, the interannual variability of QXPSC is one of the main factors affecting the interannual variability of TC track patterns and landfall locations. QXPSC as part of the WNP-EASM system changes the thermodynamic properties of the surface and the vertical circulation of the atmosphere, and then leads to changes on the location and intensity of subtropical high pressure, which in turn affects changes of TC track and landfall location.

|
| Fig.15 Influence mechanism of QXPSC on the TC landing location |
In this study, PCA of TDF is used to study the WNP TC track patterns. The main findings are summarized below.
QXPSC high-snow anomalies weaken the vertical atmospheric circulation by weakening the EASM and the surface sensible and latent heat fluxes, which in turn cause the subtropical high-pressure system to move northeastward; QXPSC low-snow anomalies enhance the vertical atmospheric circulation by strengthening the EASM and surface sensible and latent heat fluxes, which in turn cause the subtropical high-pressure system to move southwestward. Ultimately, the QXPSC could affect the WNP TC track patterns (straight or curved), thus change their landfall locations (South China, East China). Therefore, the QXPSC interannual variation is one of the main factors affecting the interannual variation of TC track patterns and landfall locations.
6 DATA AVAILABILITY STATEMENTThe datasets of the total number of tropical cyclone generation and tracks analyzed during the current study are available in the Best Track (BT) dataset of the Joint Typhoon Warning Center (JTWC) repository (https://www.metoc.navy.mil/jtwc.html); the datasets of the total number of tropical cyclone generation and location in China analyzed are available in the CMA Tropical Cyclone Data Center for the western North Pacific Basin (https://tcdata.typhoon.org.cn/zjljsjj_sm.html); the datasets of the reanalysis data on environmental factors were obtained from the National Oceanic and Atmospheric Administration (NOAA, https://psl.noaa.gov/data) and European Centre for Medium Range Weather Forecasts (ECMWF, https://www.ecmwf.int/en/forecasts/dataset/ecmwf-reanalysis-v5).
7 ACKNOWLEDGMENTWe thank anonymous reviewers for very helpful comments on the manuscript.
Electronic supplementary material
Supplementary material (Supplementary Tables S1–S5 and Figs.S1–S10) is available in the online version of this article at https://doi.org/10.1007/s00343-023-2358-4.
Anderson J R, Gyakum J R. 1989. A diagnostic study of Pacific Basin circulation regimes as determined from extratropical cyclone tracks. Monthly Weather Review, 117(12): 2672-2686.
DOI:10.1175/1520-0493(1989)117<2672:ADSOPB>2.0.CO;2 |
Bell G D, Chelliah M. 2006. Leading tropical modes associated with interannual and multidecadal fluctuations in North Atlantic hurricane activity. Journal of Climate, 19(4): 590-612.
DOI:10.1175/JCLI3659.1 |
Bell G D, Halpert M S, Ropelewski C F, et al. 1999. Climate assessment for 1998. Bulletin of the American Meteorological Society, 80(5S): S1-S48.
DOI:10.1175/1520-0477(1999)080<2261:AIUCFI>2.0.CO;2 |
Cai Y H, Han X, Zhao H K, et al. 2022. Enhanced predictability of rapidly intensifying tropical cyclones over the western North Pacific associated with snow depth changes over the Tibetan Plateau. Journal of Climate, 35(7): 2093-2110.
DOI:10.1175/JCLI-D-21-0758.1 |
Camp J, Bett P E, Golding N, et al. 2020. Verification of the 2019 GloSea5 seasonal tropical cyclone landfall forecast for East China. Journal of Meteorological Research, 34(5): 917-925.
DOI:10.1007/s13351-020-0043-5 |
Dai Y F, Wang B, Wei N, et al. 2022. How has the North Pacific Gyre Oscillation affected peak season tropical cyclone genesis over the western North Pacific from 1965 to 2020?. Environmental Research Letters, 17(10): 104016.
DOI:10.1088/1748-9326/ac89a1 |
Gao S, Chen Z F, Zhang W. 2018. Impacts of tropical North Atlantic SST on western North Pacific landfalling tropical cyclones. Journal of Climate, 31(2): 853-862.
DOI:10.1175/JCLI-D-17-0325.1 |
Kang N Y, Elsner J B. 2016. Climate mechanism for stronger typhoons in a warmer world. Journal of Climate, 29(3): 1051-1057.
DOI:10.1175/JCLI-D-15-0585.1 |
Keith E, Xie L. 2009. Predicting Atlantic tropical cyclone seasonal activity in April. Weather and Forecasting, 24(2): 436-455.
DOI:10.1175/2008WAF2222139.1 |
Knappenberger P C, Michaels P J. 1993. Cyclone tracks and wintertime climate in the mid-Atlantic region of the USA. International Journal of Climatology, 13(5): 509-531.
DOI:10.1002/joc.3370130504 |
Lee T, Cornillon P. 1995. Temporal variation of meandering intensity and domain-wide lateral oscillations of the Gulf Stream. Journal of Geophysical Research: Oceans, 100(C7): 13603-13613.
DOI:10.1029/95JC01219 |
Liu K S, Chan J C L. 2003. Climatological characteristics and seasonal forecasting of tropical cyclones making landfall along the South China coast. Monthly Weather Review, 131(8): 1650-1662.
DOI:10.1175//2554.1 |
Lorenz E N. 1956. Empirical Orthogonal Functions and Statistical Weather Prediction. Technical Report, Statistical Forecast Project Report 1, Department of Meteorology, Massachusetts Institute of Technology, Cambridge, MA, https://doi.org/10.1134/S1028334X06060377.
|
Mei W, Xie S P. 2016. Intensification of landfalling typhoons over the northwest Pacific since the late 1970s. Nature Geoscience, 9(10): 753-759.
DOI:10.1038/ngeo2792 |
Peduzzi P, Chatenoux B, Dao H, et al. 2012. Global trends in tropical cyclone risk. Nature Climate Change, 2(4): 289-294.
DOI:10.1038/nclimate1410 |
Song J J, Klotzbach P J, Wei N, et al. 2023. Modulation of western North Pacific tropical cyclone formation by central Pacific El Niño-Southern Oscillation on decadal and interannual timescales. International Journal of Climatology, 43(1): 426-437.
DOI:10.1002/joc.7777 |
Sparks N, Toumi R. 2021. On the seasonal and sub-seasonal factors influencing East China tropical cyclone landfall. Atmospheric Science Letters, 22(2): e1014.
DOI:10.1002/asl.1014 |
Sun J, Wang D Q, Hu X M, et al. 2019. Ongoing poleward migration of tropical cyclone occurrence over the western North Pacific Ocean. Geophysical Research Letters, 46(15): 9110-9117.
DOI:10.1029/2019GL084260 |
Wang B, Chan J C L. 2002. How strong ENSO events affect tropical storm activity over the western North Pacific. Journal of Climate, 15(13): 1643-1658.
DOI:10.1175/1520-0442(2002)015<1643:HSEEAT>2.0.CO;2 |
Webster P J, Holland G J, Curry J A, et al. 2005. Changes in tropical cyclone number, duration, and intensity in a warming environment. Science, 309(5742): 1844-1846.
DOI:10.1126/science.1116448 |
Wu L G, Wang B. 2004. Assessing impacts of global warming on tropical cyclone tracks. Journal of Climate, 17(8): 1686-1698.
DOI:10.1175/1520-0442(2004)017<1686:AIOGWO>2.0.CO;2 |
Wu M C, Yeung K H, Chang W L. 2006. Trends in western North Pacific tropical cyclone intensity. EOS, Transactions American Geophysical Union, 87(48): 537-538.
DOI:10.1029/2006EO480001 |
Xiang C Y, Xu Y L, Lin J, et al. 2022. Analysis of the inner rainbands of tropical cyclones over the South China Sea during the landfall process. Frontiers in Earth Science, 10: 956977.
DOI:10.3389/feart.2022.956977 |
Xiao M Z. 2021. Change in the Occurrence frequency of landfalling and non-landfalling tropical cyclones over the northwest Pacific. Journal of Climate, 34(8): 3145-3155.
DOI:10.1175/JCLI-D-20-0647.1 |
Xie L, Yan T Z. 2007. West North Pacific typhoon track patterns and their potential connection to Tibetan Plateau snow cover. Natural Hazards, 42(2): 317-333.
DOI:10.1007/s11069-006-9087-9 |
Xie L, Yan T Z, Pietrafesa L J, et al. 2005a. Climatology and interannual variability of North Atlantic hurricane tracks. Journal of Climate, 18(24): 5370-5381.
DOI:10.1175/JCLI3560.1 |
Xie L, Yan T Z, Pietrafesa L J, et al. 2005b. Relationship between western North Pacific typhoon activity and Tibetan Plateau winter and spring snow cover. Geophysical Research Letters, 32(16): L16703.
DOI:10.1029/2005GL023237 |
Zhan R F, Ding Y H, Wu L G, et al. 2016. Role of ENSO in the interannual relationship between Tibetan Plateau winter snow cover and Northwest Pacific tropical cyclone genesis frequency. Science China Earth Sciences, 59(10): 2009-2021.
DOI:10.1007/s11430-015-5559-y |
Zhan R F, Wang Y Q, Lei X T. 2011. Contributions of ENSO and east Indian Ocean SSTA to the interannual variability of northwest Pacific tropical cyclone frequency. Journal of Climate, 24(2): 509-521.
DOI:10.1175/2010JCLI3808.1 |
Zhang Q, Wu L G, Liu Q F. 2009. Tropical cyclone damages in China 1983-2006. Bulletin of the American Meteorological Society, 90(4): 489-496.
DOI:10.1175/2008BAMS2631.1 |
Zhang W, Graf H F, Leung Y, et al. 2012. Different El Niño types and tropical cyclone landfall in East Asia. Journal of Climate, 25(19): 6510-6523.
DOI:10.1175/JCLI-D-11-00488.1 |
Zhao G, Huang G, Wu R, et al. 2015. A New Upper-level Circulation Index for the East Asian Summer Monsoon Variability. Journal of Climate, 28(24): 9977-9996.
DOI:10.1175/JCLI-D-15-0272.1 |
Zhou X Y, Lu R Y. 2019. Interannual variability of the tropical cyclone landfall frequency over the southern and northern regions of East Asia in autumn. Journal of Climate, 32(24): 8677-8686.
DOI:10.1175/JCLI-D-19-0057.1 |