 2023, Vol. 41
Institute of Oceanology, Chinese Academy of Sciences
Article Information
- LOH Pei Sun, JIN Aimin, LOU Zhanghua, CHEN Xuegang, HE Shuangyan, CHEN Chen-Tung Arthur, PARKER Stephanie, HU Jianxiong, YUAN Hongwei, CHENG Longxiu
- Trends of carbon and nutrient accumulation through time in the Andong salt marsh, Hangzhou Bay, China
- Journal of Oceanology and Limnology, 41(6): 2134-2145
- http://dx.doi.org/10.1007/s00343-023-2305-4
Article History
- Received Aug. 21, 2022
- accepted in principle Oct. 15, 2022
- accepted for publication Dec. 14, 2022


2 Department of Oceanography, National Sun Yat-sen University, Kaohsiung 804, China
High primary production, accumulation of belowground biomass, and trapping of suspended sediments (Simas and Ferreira, 2007; Artigas et al., 2015) have rendered salt marshes valuable blue carbon ecosystems, nutrient sinks (González-Alcaraz et al., 2012; Etheridge et al., 2017; Velinsky et al., 2017), and regulators of water quality (Bonometto et al., 2019). Carbon accumulation occurs in salt marshes until a critical point, at which the rate of sediment accumulation is unable to keep pace with the rate of sea level rise, leading to the drowning of the salt marsh ecosystem (Mudd et al., 2009; Crosby et al., 2016). Salt marshes can be affected by sea level rise (Bi et al., 2013; Sun et al., 2018) and prolonged flooding (Bai et al., 2017; Duarte et al., 2017), causing decline in carbon accumulation rates (Chmura and Hung, 2004), which results in increased erosion and discharge of particles and metals into coastal waters (Duarte et al., 2017). The extraction of water and conversion of salt marshes to farmland have been reported to reduce the storage capacity of organic matter and nutrients (Huang et al., 2012). Excessive suspended sediments have resulted in the formation of floc materials. These floc materials settle nearby a creek, resulting in depletion of sediments to be transported to a marsh farther away. Thus, flocculation can limit the amount of sediments available for marsh accretion (Poirier et al., 2017). Furthermore, algae bloom can cause the retreat of marsh plants and accelerate the erosion of marsh banks (Wasson et al., 2017). Owing to the various threats facing salt marshes, it is crucial to determine whether these ecosystems still serve as carbon and nutrient sinks.
Various studies have been conducted to assess the degree of deterioration of salt marshes. Studies have determined the differences in fluxes of carbon and nutrients during floods and ebb tides to estimate the amount of materials absorbed or released by marsh ecosystems. If a marsh ecosystem always serves as a material source, then the marsh could be experiencing degradation. A study determined the nutrient fluxes at the salt marshes at the lower St. Lawrence Estuary, Canada, by sampling of water weekly for one year, and found that these salt marshes were sink for P and Si during period of high productivity, but become P and Si source during period of low productivity (Poulin et al., 2009). Another study of sediment and nutrient fluxes at an artificial salt marsh at the southern Venice Lagoon was carried out by sampling of water during six diurnal tidal cycles to represent different seasons. Dissolved organic carbon (DOC), particulate organic carbon (POC), nutrient concentrations (ammonia (NH4+), nitrate (NO3–), nitrite (NO2–), and orthophosphate (PO4–) and total suspended solids (TSS) were measured during ebb and flood tide. They found that accumulation process occurs when high suspended solid and nutrient concentrations enter the salt marsh, but the salt marsh functions as sediment and nutrient source during low nutrient concentrations and high tide events (Bonometto et al., 2019). Thus, flux measurement studies have revealed that whether or not salt marshes can serve as a carbon and nutrient source, or sink, is dependent on seasonal variations (Spurrier and Kjerfve, 1988), productivity (Poulin et al., 2009), and tidal cycles (Bonometto et al., 2019). Alternatively, remote sensing techniques can be employed to determine the changes in the areas of salt marshes, as a reduction in the marsh area indicates marsh deterioration. Reduction in area, and the disappearance of salt marshes altogether, has been attributed to sea level rise and coastal squeeze (Valiela et al., 2018) as well as farming, oil, and water extraction (Huang et al., 2012). The Virginia Coast Reserve marsh has diminished by 19.4% during 1984–2011, with changes in low marsh twice higher than changes in the high marsh, indicating that the low marsh was affected by sea level rise (Sun et al., 2018). Long-term monitoring of sea level rise and aerial photographs in 1979–2015 period showed possible disappearance of a New England salt marsh due coastal squeeze and higher rate of sea level rise compared to marsh accretion (Valiela et al., 2018). Another technique involves examining the carbon and nutrients accumulated along the sediment cores in these ecosystems. Recent increasing trends of carbon accumulation rates indicate the continuous accumulation of materials; thus, the salt marshes are most probably carbon sinks, and vice versa. The sediment accretion rate can be compared to the rate of sea level rise to determine whether salt marshes can be submerged. For example, sediment core data from the North Inlet salt marsh revealed that the sediment accumulation rate was 2.7 mm/a compared to the sea level increase in that region, which ranged between 2.2 and 3.4 mm/a, indicating that the marsh can keep pace with the sea level rise (Vogel et al., 1996). Determination of sedimentation rates, together with nitrogen and phosphorus concentrations, along sediment cores from Barnegat Bay marshes in New Jersey showed that nitrogen accumulation rates increased two fold since the mid-1950s, but phosphorus accumulation was lower with time. However, the marsh accretion rates were just below the rate of sea level rise, thus these marshes are vulnerable to inundation in the future (Velinsky et al., 2017). On the other hand, the investigation of the sediment cores collected from salt marshes along the southern shore of Cape Cod revealed that sea level rise facilitates the growth of the marsh plant Spartina alterniflora. As a result, the last decade witnessed increased biomass production and carbon storage in the marsh (Gonneea et al., 2019).
Hangzhou Bay is an economic dynamic zone surrounded by Shanghai to the north, Hangzhou to the west, and Zhoushan to the east (Fig. 1). The common features in the bay are coastal embankments (Xie et al., 2017) and land reclamation (Liu et al., 2017). During 1978–2017, sea level rose notably in the bay at around 4.6 mm/a, which resulted in increased flood risk areas and the increased frequency and severity of storm surges (Feng et al., 2018). The salt marsh in the southern Hangzhou Bay is an important sink for sediment from the Changjiang (Yangtze) River and Qiantang River (Li and Xie, 1993; Che et al., 2003; van der Wegen and Roelvink, 2008; Wang et al., 2008) and will most probably be affected by human activities surrounding the bay and by sea level rise. Previous studies conducted in the Andong salt marsh focused on identifying the heavy metal pollution (Pang et al., 2015) and biogeochemistry of sedimentary organic matter along the surface sediments across transects of the salt marsh (Yuan et al., 2017). Studies also investigated sediment cores from the salt marsh for heavy metals (Jin et al., 2017), sedimentary organic matter (Loh et al., 2018), and phosphorus species (Cheng et al., 2019). These studies reported that human activities and extreme weather events have been affecting the distribution profile of organic and inorganic matter in the sediments for the past three decades.

|
| Fig.1 Map showing the study area of the Andong salt marsh in the southwest of Hangzhou Bay, and the locations of cores C1 and C2 in the salt marsh |
A study of the accumulation rates of sedimentary total organic carbon (TOC), total nitrogen (TN), total phosphorus (TP), in the Andong salt marsh will provide information on whether the salt marsh has a tendency to accumulate carbon and nutrients. If the carbon and nutrient accumulation rates increased toward the present, this could mean that the salt marsh has a tendency to accumulate carbon and nutrients, and vice versa. Thus, trends in carbon and nutrient accumulations can indicate how a salt marsh situated in a bay is affected by reduced riverine input and sea level rise. Besides, the presence of dams can cause a reduction in particle size downstream (which results in increased TOC adsorption) and changes in contribution from soil, marine and terrestrial organic matter fractions. The objectives of this study are to determine whether the salt marsh exhibits a tendency to accumulate carbon and nutrients and has a potential to be affected by sea level rise.
2 MATERIAL AND METHOD 2.1 Sediment sampling and pretreatmentWith an area of ~300 km2, the Andong salt marsh is located close to the town of Andong in the southwestern area of Hangzhou Bay. Water from the Changjiang River and the East China Sea flows into Hangzhou Bay from the north and exits through the south side of the bay (Che et al., 2003; Xie et al., 2009, 2013). Sediment cores of 130 and 205 cm were collected from the Andong salt marsh on October 14–15, 2015 in two locations: C1 (30°22′41″N; 121°10′19″E) and C2 (30°22′26″N; 121°12′20″E), where C2 was situated at relatively upper marsh than C1 (Fig. 1). C1 and C2 were measured for 210Pb activity until the lengths of 127.5 and 202.5 cm, respectively; analyses of other parameters were carried out until the lengths of 127.5 and 162.5 cm at C1 and C2, respectively.
The upper marsh was densely covered by marsh plants S. alterniflora that was scattered in the middle marsh and was absent in the low marsh. The upper marsh was predominated by clayey-silty sediments, the middle marsh was characterized by silt, and lower marsh was covered by silt and sandy silt (Li and Xie, 1993). The marsh was predominated by S. alterniflora. The sediment cores were collected using a gravity columnar sampler lined with a polyvinyl chloride core tube 60 mm in diameter. In the laboratory, sediments were sliced at 5-cm intervals, dried at 45 ℃ for three days until reaching a constant weight, and then mortar ground.
2.2 Determination of 210Pb activitiesThe 210Pb activities were used to calculate the sediment accretion rates using the constant initial concentration model. 210Pb activity was measured from sediment layers at 10-cm intervals using a GWL series high-purity germanium low gamma spectrometer with a high-purity germanium coaxial well photon detector system (AMETEK-AMT Ortec Co., USA) based on the China's National Standard GB/T11743-2013 for determining radionuclides by soil gamma energy spectrum analysis. Mean accretion rates were estimated from the slope of the measured 210Pb activity along the depth profile (Jin et al., 2017; Loh et al., 2018). The ages of each sediment layer were calculated by multiplying the mean accretion rate of each core by the depths of the respective sediment layer.
2.3 Particle sizeThe effect of sedimentary particle size on the TOC, TN, and TP accumulation rates was determined. For particle size determination, sediments were subjected to H2O2 digestion and (NaPO3)6 dispersion, and the particle size was determined using a laser particle size analyzer (BT-9300Z, Dandong Baite Instruments Co., Ltd., China; Jin et al., 2017).
2.4 Bulk elemental composition and stable carbon isotopeResult of bulk elemental composition (TOC, TN, and TOC/TN) and stable carbon isotope (δ13C) were used for determination of TOC and TN accumulation rates, and sedimentary organic matter fractions (Section 2.6). For bulk elemental analysis, 1-mol/L HCl was added to the dry sediment to remove the inorganic carbon (IC) fraction. After 24 h, sediments were oven dried, homogenized with mortar and pestle, weighed precisely in tin foil, and crimped into pellets. Sediments were analyzed for total organic carbon (TOC) and total nitrogen (TN) contents using a Vario EL Ⅲ elemental analyzer. BSCC and NIST2704 were used as standard reference materials. The average coefficients of variation for TOC and TN were 2.32% and 3.08%, respectively. The C/N ratios were calculated as TOC/TN molar ratios.
After the initial pretreatment steps to remove the IC using HCl, the sediments were dried, homogenized, weighed in tin foil, and crimped. Stable carbon isotopes were determined using a Model Flash 2000 elemental analyzer coupled with a ConFlo Ⅳ system and a Delta Ⅴ Plus isotope ratio mass spectrometer (Thermo Fisher Scientific, Germany). The analytical precision was 0.2% based on repeated measurements of laboratory-standard Pee Dee Belemnite.
2.5 Total phosphorusThe total phosphorus (TP) determined from this experiment was used to calculate the TP accumulation rate. Precisely 200 mg of dry sediment was added with 1-mol/L HCl in a centrifuge tube and then extracted by shaking for 16 h. Next, the sample was centrifuged at 2 000 r/min for 15 min, and the supernatant was determined for inorganic phosphorus (IP) content. The residue was dried at 80 ℃ for 3 h, combusted at 450 ℃ for 3 h, added with 1-mol/L HCl, and then the solution was subjected to shaking for 16 h. The solution was centrifuged at 2 000 r/min for 15 min and the supernatant was determined for organic phosphorus (OP) content (Ruttenberg, 1992; Ruban et al., 1999). IP and OP concentrations were determined colorimetrically as a molybdenum blue complex by absorbance measurement at a wavelength of 885 nm using a UV-visible spectrophotometer (UV-8000, METASH, Shanghai, China). TP is the sum of the IP and OP.
2.6 Calculation of sedimentary organic matter fractions and accumulations ratesThe importance of contribution of different provenance of organic matter to the sediments was assessed by determination of different sedimentary organic matter fractions. For this purpose, fractions of terrestrial plant (fT), soil (fS), and phytoplankton (fM) sedimentary organic matter were determined by solving the following equations:
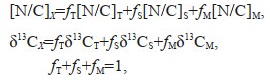
where X: sample; T: terrestrial C3 plant end member; S: soil end member; and M: marine phytoplankton end member. The following assumptions were applied: [N/C]T=0.033, [N/C]S=0.067, [N/C]M=0.152, δ13CT=-30.0‰, δ13CS=-23.0‰, and δ13CM=-19.5‰. The marine end-member values were obtained from Gordon and Goñi (2003) and Zhang et al. (2007). The terrestrial end-member value for N/C was obtained from Yang et al. (2008), and δ13CT was obtained from Li et al. (2015) in the Changjiang River estuary. The soil end-member values were obtained from Yang et al. (2008) and Sun et al. (2021) for the Changjiang River basin soil samples. All end-members used are in consistent with another study at the East China Sea inner shelf (Hu et al., 2014).
The TOC, TN, and TP accumulation rates were determined using the following equations:
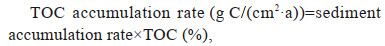
where the sediment accumulation rate (g/(cm2·a))= sedimentation rate (cm/a)×DBD (g/cm3), and dry bulk density (DBD)=1.3 g/cm3.
3 RESULT 3.1 Sediment chronology and particle sizeThe 210Pb activities showed a linear decrease with increasing depths (Fig. 2). Sedimentation rates were calculated based on 210Pb activities according to the constant initial concentration model, resulting in 5.03 and 4.89 cm/a in C1 and C2, respectively. The total years represented by cores C1 (127.5 cm) and C2 (until the core length of 162.5 cm) were 25 and 33 years, respectively.

|
| Fig.2 Sedimentation rates for C1 (left) and C2 (right) calculated from 210Pb dating |
The mean particle size in C1 and C2 ranged 25.92–34.92 µm and 7.76–33.03 µm, with mean values of 30.36±2.90 µm and 20.28±6.11 µm, respectively. Particle size showed a general trend of decreasing from the bottom toward the surface in the C1 and C2 cores (Fig. 3). In C1, the particle size decreased from 34.92 µm in 1992 to 25.92 µm in 2002, and then increased to 31.91 µm in 2004, followed by a gradual decrease to 26.64 µm in 2014. In C2, the particle size decreased from 33.03 µm in 1985 to 7.76 µm in 2003, increased again in 2005, and then decreased from 22.56 µm in 2008 to 19.64 µm in 2015, during which another low value of 9.1 µm was detected in 2011 (Fig. 3).

|
| Fig.3 Particle size for C1 (left) and C2 (right) |
Complete results of TOC, TN, TP, TOC/TN molar ratio, δ13C, particle size, and TOC, TN, and TP accumulation rates are presented in the Supplementary Table S1. Significant correlations (P < 0.05) occurred between TOC, TN, and TP and their accumulation rates along C1 and C2. Hence, only the results of TOC, TN, and TP accumulation rates are presented and discussed here.
TOC and TN accumulation rates along C1 showed a trend of increasing fluctuations and increased rates from the bottom to surface sediments. The TOC accumulation rates fluctuated between 1.63 and 2.37 g/(cm2·a) during 1990–1996. The lowest TOC accumulation rate of 0.67 g/(cm2·a) was detected in 1996; after that, the rates fluctuated between 1.15 and 4.30 g/(cm2·a) in 1997–2014. The TN accumulation rates showed a gradual increase from 0.14 g/(cm2·a) in 1990 to 0.40 g/(cm2·a) in 2012 and then decreased to 0.16 g/(cm2·a) in 2014, with the lowest value of 0.09 g/(cm2·a) detected in 1996. The TP accumulation rates showed lower values and fluctuations between 0.10 and 0.21 mg/(cm2·a) in 1990–1999. TP accumulation rate was the highest in 2000 and then decreased from 0.32 mg/(cm2·a) in 2000 to 0.15 mg/(cm2·a) in 2014 (Fig. 4). Particle size showed no significant correlations (P > 0.05) with TOC, TN, TP, or their accumulation rates (Supplementary Table S2).

|
| Fig.4 The TOC (left panel), TN (middle panel), and TP (right panel) accumulation rates in C1 (upper panel) and C2 (lower panel) |
Along the C2 core, the TOC accumulation rates exhibited higher fluctuations between 1982 and 1992 (1.18–3.25 g/(cm2·a)), and the rates became considerably constant in 1993–1997 (2.29–2.58 g/(cm2·a)). Higher values and greater fluctuations in 1998–2010 were observed (2.30–4.20 g/(cm2·a)), after which the TOC accumulation rate showed a general trend of decreasing to 2.15 g/(cm2·a) in 2015. TN showed an increase from 0.18 g/(cm2·a) in 1982 to 0.41 g/(cm2·a) in 2005. Afterward, there was a trend of decreasing TN accumulation rate to 0.22 g/(cm2·a) in 2015. TP accumulation rates fluctuated within a narrow range from 0.21 to 0.41 mg/(cm2·a) in 1982–1997, after which the TP accumulation rates increased from 0.50 mg/(cm2·a) in 1998 to 0.75 mg/(cm2·a) in 2003 and then decreased from 0.87 mg/(cm2·a) in 2004 to 0.38 mg/(cm2·a) in 2015 (Fig. 4). Contrary to the C1 core, particle size had significant negative correlations with TOC, TN, TP, and their accumulation rates along C2 (P < 0.05; Supplementary Table S2).
3.3 Sedimentary organic matter fractionsResults of sedimentary terrestrial, soil, and marine fractions are presented in the Supplementary Table S3 and Fig. 5. The soil fraction (fS) along C1 ranged from 0.05 to 0.93 and was composed of the largest portion of organic matter from around 1990 to 2000, except for the years 1996 and 1997. It showed a general trend of gradual decrease of fS from 0.51 in 2000 to 0.21 in 2014. The marine (fM) and terrestrial (fT) fractions showed overall lower values before 2000. Overall, these two fractions of organic matter showed a gradual increasing trend from the bottom to the surface sediments, with a drastic increase in 1997. The terrestrial fraction showed smaller fluctuations between 2002 and 2014 (fT ranged from 0.33 to 0.47), and the marine fraction showed a decrease of fM from 0.58 in 2002 to 0.33 in 2015. The soil fraction (fS) along C2 showed fluctuations before 2006 and then a gradual decrease from 0.70 in 2006 and 2007 to 0.12 in 2015. The marine and terrestrial fractions showed fluctuations before 2006, with fT showing a gradual decrease from 0.65 in 1995 to 0.27 in 2007. After 2006, however, there were constant increases in both fM and fT toward 2015 (Fig. 5).

|
| Fig.5 Fractions of soil (fS) (upper panel), marine (fM) (middle panel) and terrestrial (fT) (lower panel) organic matter for C1 (left panel) and C2 (right panel) |
The stability of salt marshes depends on their elevation in relation to sea level rise (Morris et al., 2002), as these ecosystems are in danger of disappearing if their accretion rates do not match the rate of sea level rise (Crosby et al., 2016; Best et al., 2018). Sea level rise may limit vegetation production at the seaward edge of the salt marsh (Chmura, 2013). Sea level rise and increased flooding can also result in increased erosion and transport of particles from marshes to the shelf (Duarte et al., 2017). Besides, prolonged flooding may submerge vegetation (Chmura, 2013) and cause higher denitrification rates in salt marshes (Bai et al., 2017), thus affecting the carbon and nutrient dynamics of the salt marsh system (Negrin et al., 2011). Hence, comparison of marsh accretion rate with the rate of sea level rise will provide information whether the marsh has a tendency to be submerged.
The mean rate of sea level rise in China from 2000 to 2001 was measured as 1.97 mm/a, while Zhejiang Province exhibited a relatively low rate of sea level rise of 0.25 mm/a (Bi et al., 2013). The mean sea level rise in Hangzhou Bay between 1978 and 2017 was reported to be 4.6 mm/a (Feng et al., 2018). The mean accumulation rate of 5 cm/a in the Andong salt marsh, which was higher than the rate of sea level rise along the Zhejiang coast and Hangzhou Bay, indicates that the marsh might not be in danger of being submerged by the sea.
The sediment accretion rate at the Andong salt marsh is greater than that of some salt marshes worldwide (Table 1), such as a restored salt marsh in New Jersey (Artigas et al., 2015), the Delaware Bay and Barnegat Bay (Boyd et al., 2017; Velinsky et al., 2017), and a macro-tidal salt marsh along the east coast of the United Kingdom (Schuerch et al., 2019). Closer to our study area, the Andong salt marsh has a greater sedimentation rate than the Changjiang River estuary, which has a sedimentation rate that ranges from 0.19 to 0.34 cm/a (Li et al., 2011), and the East China Sea shelf break, which ranges from 0.26 to 0.31 cm/a (Li et al., 2016). A high sedimentation rate of 16 cm/a observed at the salt marsh on Chongming Island at the Changjiang River estuary was attributed to the high levels of suspended particulate matter (Zhou et al., 2006; Yang et al., 2016). Thus, the high sedimentation rate in the Andong salt marsh is in consistent with the high sedimentation rate in the Chongming salt marsh. The high levels of suspended materials in Hangzhou Bay (Che et al., 2003) could be the reason for the high accretion rates observed in the Andong salt marsh.

|

|
| Fig.7 Comparison of TOC accumulation rates and marsh accretion rates between other studies and this study |
The mean TOC accumulation rates along C1 and C2 were estimated to be 2.22 and 2.80 g/(cm2·a), respectively. Hence, the OC accumulation rate in the Andong salt marsh is considerably greater than the rate in some other salt marshes worldwide (Table 1), such as the S. maritima salt marsh sediments in the Tagus and Mondego estuaries (Sousa et al., 2010), a restored salt marsh in New Jersey (Artigas et al., 2015), an S. alterniflora salt marsh in Jiangsu, China (Xiang et al., 2015), and salt marshes of the Barnegat Bay and Delaware estuary (Unger et al., 2016; Boyd et al., 2017; Velinsky et al., 2017). The higher rates are possibly due to the high concentrations of suspended matter and high sedimentation rates in the Andong salt marsh area.
Trends of carbon and nutrient accumulation rates along sediment cores will provide information on the effect of climate and human on the dynamics of sedimentary organic carbon and nutrients throughout the time span covered by the cores. For instance, study of sediment cores from the Changjiang River estuary showed an increase in terrestrial organic matter of woody plants due to deforestation since the early 1950s, but there was no increase in woody materials after the 1960s because of the increased trapping of materials by dams. There has been an overall reduction in deforestation and increased conservation since the 1990s (Li et al., 2011). In contrast to Li et al. (2011) who found trend of decreasing terrestrial organic matter toward the present, our results showed a slight increase in TOC and TN (Fig. 4), and increased terrestrial fraction of organic matter (fT) in C1, from around 1985 toward 2000, and a higher proportion of fT along C2 during this period (Fig. 5). This could be attributable to the increased land reclamation along the surrounding coastal areas of Hangzhou Bay after the 1980s (Xie et al., 2017). Extreme weather events could also affect the composition of sedimentary organic matter (Tesi et al., 2008). Thus, the lowest TOC, TN, and TP accumulation rates at C1 during 1996 was due to the rather low precipitation of that time (Cao et al., 2013). Increased TOC, TN, and TP accumulations and fT in 1997–1999 could be due to the occurrence of the super typhoon Winnie in 1997 resulting in increased delivery of land-derived organic matter to the sea.
Sediment deposition is critical for salt marsh accretion. Hence, altering sediment supply by damming upstream rivers can lead to a significant change in the carbon budgets of coastal salt marshes (Mudd et al., 2009). The annual sediment load from the Changjiang River decreased from ~4.18×10⁸ t to less than 2×10⁸ t after the construction of the Three Gorges Dam upstream (Dai et al., 2011). The reduced sediment load and terrestrial OC input in turn resulted in enhanced delta erosion, which resulted in the increased input of delta OC to the coastal area. On the other hand, even with the contribution of delta OC, there was an overall reduction in the burial of terrestrial OC in the Changjiang River delta due to the low delta OC content and intense decomposition of the deltaic OC (Zhao et al., 2021). As most of the material in Hangzhou Bay originates from the Changjiang River (Che et al., 2003), the Andong salt marsh at the southwestern area of the bay is most likely affected by the decreased discharge from the Changjiang River. Thus, the high TOC, TN, and TP accumulation rates around 2000 could be due to input from increased erosion from the Changjiang River estuary. However, the overall decline in TOC, TN, and TP from 2000 to 2015 could be the overall effects of the trapping of materials within the Changjiang River due to the presence operation of dams.
Another effect of reservoirs is related to the overall reduction in particle sizes (Wu et al., 2013), which was also observed in the Andong salt marsh in terms of the overall decrease in particle size from 1982 to 2015 (Fig. 3). Small particles have a large surface area to absorb carbon and nutrients (Pedrosa-Pàmies et al., 2013). However, the reduction in particle size along the Andong salt marsh (Fig. 2) did not correspond to increased TOC, TN, and TP accumulations. On the contrary, TOC, TN, and TP levels showed a 50% decrease in 2000–2015, further signifying an overall decline in carbon and nutrient inputs from upstream rivers.
Our results show positive relationship between soil fraction and both TOC (%) and TOC accumulation rate (correlations were significant in C2), whereas phytoplankton and terrestrial organic matter have a negative correlation with both TOC and TOC accumulation rate (Supplementary Table S2), thus, indicating that soil is an important factor contributing to TOC accumulation rates and that reduced TOC accumulation rates toward the present was in consistent with reduced soil organic matter toward the present. Our results are in consistent with a study of sediment core from a salt marsh in the eastern Chongming Island off Changjiang River estuary revealed a recent increase in marine organic matter resulting from the reduction in sediment inputs due to the presence of reservoirs (Zhang et al., 2014) and increased eutrophication (Zhao et al., 2021). Our results are also in consistent with other Chinese coastal zones that exhibited decreasing trends of soil organic matter in recent years while marine and terrestrial organic matter exhibited increasing trends (Li et al., 2011, 2016).
5 CONCLUSIONIn modern times, the mean accretion rate of the Andong salt marsh is 5 cm/a. In comparison to the 0.46 cm/a rate of sea level rise in Hangzhou Bay, it does not expose the Andong salt marsh of being submerged as a result of sea level rise. Our results reveal increasing trends of TOC, TN, and TP accumulation rates from around 1982 to 2000, indicating that the salt marsh most probably accumulated carbon and nutrients during this time due to land reclamation along the surrounding coastal areas of Hangzhou Bay after the 1980s and the occurrence of extreme weather such as typhoon. However, there was about a 50% reduction in TOC, TN, and TP accumulation rates from 2000 to 2015, signifying a decline in the accumulation of materials in the salt marsh since 20 years due to effect by the continuous reduction in riverine soil organic matter and sea level rise. Our results show that TOC, TN, and TP accumulation rates and soil organic matter were decreasing while marine organic matter were increasing from about 2000 toward the present, which could indicate that the Andong salt marsh is affected by sea level rise and is in danger of being submerged. Therefore, even though comparisons between marsh sedimentation rate and rate of sea level rise in this area showed that the Andong salt marsh is not in danger of being submerged by the sea, the continuous decrease in the TOC, TN, and TP accumulation rates should serve as a warning sign to policy makers that the salt marsh may be in danger of being submerged in the future.
6 DATA AVAILABILITY STATEMENTAll data generated and/or analyzed during this study are included in this manuscript and supplementary materials.
7 ACKNOWLEDGMENTThe authors wish to thank everyone for their assistance in sampling the sediment cores. We are grateful to the reviewers for the comments that have improved this manuscript greatly.
Electronic supplementary material
Supplementary material (Supplementary Tables S1–S3) is available in the online version of this article at https://doi.org/10.1007/s00343-023-2305-4.
Artigas F, Shin J Y, Hobble C, et al. 2015. Long term carbon storage potential and CO2 sink strength of a restored salt marsh in New Jersey. Agricultural and Forest Meteorology, 200: 313-321.
DOI:10.1016/j.agrformet.2014.09.012 |
Bai J H, Wang X, Jia J, et al. 2017. Denitrification of soil nitrogen in coastal and inland salt marshes with different flooding frequencies. Physics and Chemistry of the Earth, Parts A/B/C, 97: 31-36.
DOI:10.1016/j.pce.2017.01.015 |
Best Ü S N, Van der Wegen M, Dijkstra J, et al. 2018. Do salt marshes survive sea level rise? Modelling wave action, morphodynamics and vegetation dynamics. Environmental Modelling & Software, 109: 152-166.
DOI:10.1016/j.envsoft.2018.08.004 |
Bi X L, Lu Q S, Pan X B. 2013. Coastal use accelerated the regional sea-level rise. Ocean & Coastal Management, 82: 1-6.
DOI:10.1016/j.ocecoaman.2013.04.012 |
Bonometto A, Feola A, Rampazzo F, et al. 2019. Factors controlling sediment and nutrient fluxes in a small microtidal salt marsh within the Venice Lagoon. Science of the Total Environment, 650: 1832-1845.
DOI:10.1016/j.scitotenv.2018.09.142 |
Boyd B M, Sommerfield C K, Elsey-Quirk T. 2017. Hydrogeomorphic influences on salt marsh sediment accumulation and accretion in two estuaries of the U.S. Mid-Atlantic coast. Marine Geology, 383: 132-145.
DOI:10.1016/j.margeo.2016.11.008 |
Cao Y Q, Lu L, Zhang T T, et al. 2013. Spatio-temporal variation in precipitation in Zhejiang Province based on PCD and PCP. Resources Science, 35(5): 1001-1006.
(in Chinese with English abstract) |
Che Y, He Q, Lin W Q. 2003. The distributions of particulate heavy metals and its indication to the transfer of sediments in the Changjiang Estuary and Hangzhou Bay, China. Marine Pollution Bulletin, 46(1): 123-131.
DOI:10.1016/S0025-326X(02)00355-7 |
Cheng L X, Loh P S, Lou Z H, et al. 2019. A 30-year record of sedimentary phosphorus species in a coastal salt marsh southwest of Hangzhou Bay, China. Cogent Environmental Science, 5(1): 1636549.
DOI:10.1080/23311843.2019.1636549 |
Chmura G L. 2013. What do we need to assess the sustainability of the tidal salt marsh carbon sink?. Ocean & Coastal Management, 83: 25-31.
DOI:10.1016/j.ocecoaman.2011.09.006 |
Chmura G L, Hung G A. 2004. Controls on salt marsh accretion: a test in salt marshes of eastern Canada. Estuaries, 27(1): 70-81.
DOI:10.1007/BF02803561 |
Crosby S C, Sax D F, Palmer M E, et al. 2016. Salt marsh persistence is threatened by predicted sea-level rise. Estuarine, Coastal and Shelf Science, 181: 93-99.
DOI:10.1016/j.ecss.2016.08.018 |
Dai Z J, Du J Z, Zhang X L, et al. 2011. Variation of riverine material loads and environmental consequences on the Changjiang (Yangtze) Estuary in recent decades (1955-2008). Environmental Science & Technology, 45(1): 223-227.
DOI:10.1021/es103026a |
Duarte B, Vaz N, Valentim J M, et al. 2017. Revisiting the outwelling hypothesis: modelling salt marsh detrital metal exports under extreme climatic events. Marine Chemistry, 191: 24-33.
DOI:10.1016/j.marchem.2016.12.002 |
Etheridge J R, Burchell Ⅱ M R, Birgand F. 2017. Can created tidal marshes reduce nitrate export to downstream estuaries?. Ecological Engineering, 105: 314-324.
DOI:10.1016/j.ecoleng.2017.05.009 |
Feng J L, Li W S, Wang H, et al. 2018. Evaluation of sea level rise and associated responses in Hangzhou Bay from 1978 to 2017. Advances in Climate Change Research, 9(4): 227-233.
DOI:10.1016/j.accre.2019.01.002 |
Gonneea M E, Maio C V, Kroeger K D, et al. 2019. Salt marsh ecosystem restructuring enhances elevation resilience and carbon storage during accelerating relative sea-level rise. Estuarine, Coastal and Shelf Science, 217: 56-68.
DOI:10.1016/j.ecss.2018.11.003 |
González-Alcaraz M N, Egea C, Jiménez-Cárceles F J, et al. 2012. Storage of organic carbon, nitrogen and phosphorus in the soil-plant system of Phragmites australis stands from a eutrophicated Mediterranean salt marsh. Geoderma, 185-186: 61-72.
DOI:10.1016/j.geoderma.2012.03.019 |
Gordon E S, Goñi M A. 2003. Sources and distribution of terrigenous organic matter delivered by the Atchafalaya River to sediments in the northern Gulf of Mexico. Geochimica et Cosmochimica Acta, 67(23): 2359-2375.
DOI:10.1016/S0016-7037(02)01412-6 |
Hu B Q, Li J, Zhao J T, et al. 2014. Late Holocene elemental and isotopic carbon and nitrogen records from the East China Sea inner shelf: implications for monsoon and upwelling. Marine Chemistry, 162: 60-70.
DOI:10.1016/j.marchem.2014.03.008 |
Huang L B, Bai J H, Chen B, et al. 2012. Two-decade wetland cultivation and its effects on soil properties in salt marshes in the Yellow River Delta, China. Ecological Informatics, 10: 49-55.
DOI:10.1016/j.ecoinf.2011.11.001 |
Jin A M, Yang L, Chen X G, et al. 2017. Ecological risk and contamination history of heavy metals in the Andong tidal flat, Hangzhou Bay, China. Human and Ecological Risk Assessment: An International Journal, 23(3): 617-640.
DOI:10.1080/10807039.2016.1263541 |
Li X X, Bianchi T S, Yang Z S, et al. 2011. Historical trends of hypoxia in Changjiang River estuary: applications of chemical biomarkers and microfossils. Journal of Marine Systems, 86(3-4): 57-68.
DOI:10.1016/j.jmarsys.2011.02.003 |
Li Y, Xie Q C. 1993. Zonation of sediment and sedimentary rate on Andong tidal fl at in Hangzhou Bay, China. Donghai Marine Science, 11(1): 21-33.
(in Chinese with English abstract) |
Li Z Q, Peterse F, Wu Y, et al. 2015. Sources of organic matter in Changjiang (Yangtze River) bed sediments: preliminary insights from organic geochemical proxies. Organic Geochemistry, 85: 11-21.
DOI:10.1016/j.orggeochem.2015.04.006 |
Li Z Q, Wu Y, Liu S M, et al. 2016. An 800-year record of terrestrial organic matter from the East China Sea shelf break: links to climate change and human activity in the Changjiang Basin. Deep Sea Research Part Ⅱ: Topical Studies in Oceanography, 124: 64-73.
DOI:10.1016/j.dsr2.2015.01.006 |
Liu Y F, Xia X M, Chen S L, et al. 2017. Morphological evolution of Jinshan Trough in Hangzhou Bay (China) from 1960 to 2011. Estuarine, Coastal and Shelf Science, 198: 367-377.
DOI:10.1016/j.ecss.2016.11.004 |
Loh P S, Cheng L X, Yuan H W, et al. 2018. Impacts of human activity and extreme weather events on sedimentary organic matter in the Andong salt marsh, Hangzhou Bay, China. Continental Shelf Research, 154: 55-64.
DOI:10.1016/j.csr.2018.01.005 |
Morris J T, Sundareshwar P V, Nietch C T, et al. 2002. Responses of coastal wetlands to rising sea level. Ecology, 83(10): 2869-2877.
DOI:10.1890/0012-9658(2002)083[2869:ROCWTR]2.0.CO;2 |
Mudd S M, Howell S M, Morris J T. 2009. Impact of dynamic feedbacks between sedimentation, sea-level rise, and biomass production on near-surface marsh stratigraphy and carbon accumulation. Estuarine, Coastal and Shelf Science, 82(3): 377-389.
DOI:10.1016/j.ecss.2009.01.028 |
Negrin V L, Spetter C V, Asteasuain R O, et al. 2011. Influence of flooding and vegetation on carbon, nitrogen, and phosphorus dynamics in the pore water of a Spartina alterniflora salt marsh. Journal of Environmental Sciences, 23(2): 212-221.
DOI:10.1016/S1001-0742(10)60395-6 |
Pang H J, Lou Z H, Jin A M, et al. 2015. Contamination, distribution, and sources of heavy metals in the sediments of Andong tidal flat, Hangzhou bay, China. Continental Shelf Research, 110: 72-84.
DOI:10.1016/j.csr.2015.10.002 |
Pedrosa-Pàmies R, Sanchez-Vidal A, Calafat A, et al. 2013. Impact of storm-induced remobilization on grain size distribution and organic carbon content in sediments from the Blanes Canyon area, NW Mediterranean Sea. Progress in Oceanography, 118: 122-136.
DOI:10.1016/j.pocean.2013.07.023 |
Poirier E, van Proosdij D, Milligan T G. 2017. The effect of source suspended sediment concentration on the sediment dynamics of a macrotidal creek and salt marsh. Continental Shelf Research, 148: 130-138.
DOI:10.1016/j.csr.2017.08.017 |
Poulin P, Pelletier É, Koutitonski V G, et al. 2009. Seasonal nutrient fluxes variability of northern salt marshes: examples from the lower St. Lawrence Estuary. Wetlands Ecology and Management, 17(6): 655-673.
DOI:10.1007/s11273-009-9141-y |
Ruban V, López-Sánchez J F, Pardo P, et al. 1999. Selection and evaluation of sequential extraction procedures for the determination of phosphorus forms in lake sediment. Journal of Environmental Monitoring, 1(1): 51-56.
DOI:10.1039/A807778I |
Ruttenberg K C. 1992. Development of a sequential extraction method for different forms of phosphorus in marine sediments. Limnology and Oceanography, 37(7): 1460-1482.
DOI:10.4319/lo.1992.37.7.1460 |
Schuerch M, Spencer T, Evans B. 2019. Coupling between tidal mudflats and salt marshes affects marsh morphology. Marine Geology, 412: 95-106.
DOI:10.1016/j.margeo.2019.03.008 |
Simas T C, Ferreira J G. 2007. Nutrient enrichment and the role of salt marshes in the Tagus estuary (Portugal). Estuarine, Coastal and Shelf Science, 75(3): 393-407.
DOI:10.1016/j.ecss.2007.05.046 |
Sousa A I, Lillebø A I, Pardal M A, et al. 2010. The influence of Spartina maritima on carbon retention capacity in salt marshes from warm-temperate estuaries. Marine Pollution Bulletin, 61(4-6): 215-223.
DOI:10.1016/j.marpolbul.2010.02.018 |
Spurrier J D, Kjerfve B. 1988. Estimating the net flux of nutrients between a salt marsh and a tidal creek. Estuaries, 11(1): 10-14.
DOI:10.2307/1351713 |
Sun C, Fagherazzi S, Liu Y X. 2018. Classification mapping of salt marsh vegetation by flexible monthly NDVI time-series using Landsat imagery. Estuarine, Coastal and Shelf Science, 213: 61-80.
DOI:10.1016/j.ecss.2018.08.007 |
Sun X S, Fan D J, Cheng P, et al. 2021. Source, transport and fate of terrestrial organic carbon from Yangtze River during a large flood event: insights from multiple-isotopes (δ13C, δ15N, Δ14C) and geochemical tracers. Geochimica et Cosmochimica Acta, 308: 217-236.
DOI:10.1016/j.gca.2021.06.004 |
Tesi T, Langone L, Goñi M A, et al. 2008. Changes in the composition of organic matter from prodeltaic sediments after a large flood event (Po River, Italy). Geochimica et Cosmochimica Acta, 72(8): 2100-2114.
DOI:10.1016/j.gca.2008.02.005 |
Unger V, Elsey-Quirk T, Sommerfield C, et al. 2016. Stability of organic carbon accumulating in Spartina alterniflora-dominated salt marshes of the Mid-Atlantic U.S.. Estuarine, Coastal and Shelf Science, 182: 179-189.
DOI:10.1016/j.ecss.2016.10.001 |
Valiela I, Lloret J, Bowyer T, et al. 2018. Transient coastal landscapes: rising sea level threatens salt marshes. Science of the Total Environment, 640-641: 1148-1156.
DOI:10.1016/j.scitotenv.2018.05.235 |
van der Wegen M, Roelvink J A. 2008. Long-term morphodynamic evolution of a tidal embayment using a two-dimensional, process-based model. Journal of Geophysical Research: Oceans, 113(C3): C03016.
DOI:10.1029/2006JC003983 |
Velinsky D J, Paudel B, Belton T J, et al. 2017. Tidal marsh record of nutrient loadings in Barnegat Bay, New Jersey. Journal of Coastal Research, 78(sp1): 79-88.
DOI:10.2112/SI78-008.1 |
Vogel R L, Kjerfve B, Gardner L R. 1996. Inorganic sediment budget for the North Inlet salt marsh, South Carolina, U.S.A.. Mangroves and Salt Marshes, 1(1): 23-35.
DOI:10.1023/A:1025990027312 |
Wang Z B, Wang Z Y, De Vriend H J. 2008. Impact of water diversion on the morphological development of the Lower Yellow River. International Journal of Sediment Research, 23(1): 13-27.
DOI:10.1016/S1001-6279(08)60002-5 |
Wasson K, Jeppesen R, Endris C, et al. 2017. Eutrophication decreases salt marsh resilience through proliferation of algal mats. Biological Conservation, 212: 1-11.
DOI:10.1016/j.biocon.2017.05.019 |
Wu H P, Zeng G M, Liang J, et al. 2013. Changes of soil microbial biomass and bacterial community structure in Dongting Lake: impacts of 50, 000 dams of Yangtze River. Ecological Engineering, 57: 72-78.
DOI:10.1016/j.ecoleng.2013.04.038 |
Xiang J, Liu D Y, Ding W X, et al. 2015. Invasion chronosequence of Spartina alterniflora on methane emission and organic carbon sequestration in a coastal salt marsh. Atmospheric Environment, 112: 72-80.
DOI:10.1016/j.atmosenv.2015.04.035 |
Xie D F, Gao S, Wang Z B, et al. 2013. Numerical modeling of tidal currents, sediment transport and morphological evolution in Hangzhou Bay, China. International Journal of Sediment Research, 28(3): 316-328.
DOI:10.1016/S1001-6279(13)60042-6 |
Xie D F, Pan C H, Wu X G, et al. 2017. Local human activities overwhelm decreased sediment supply from the Changjiang River: continued rapid accumulation in the Hangzhou Bay-Qiantang Estuary system. Marine Geology, 392: 66-77.
DOI:10.1016/j.margeo.2017.08.013 |
Xie D F, Wang Z B, Gao S, et al. 2009. Modeling the tidal channel morphodynamics in a macro-tidal embayment, Hangzhou Bay, China. Continental Shelf Research, 29(15): 1757-1767.
DOI:10.1016/j.csr.2009.03.009 |
Yang L Y, Wu Y, Zhang J, et al. 2008. Distribution of lignin and sources of organic matter in surface sediments from the adjacent area of the Changjiang Estuary in China. Acta Oceanologica Sinica, 30(5): 35-42.
(in Chinese with English abstract) |
Yang W, Li N, Leng X, et al. 2016. The impact of sea embankment reclamation on soil organic carbon and nitrogen pools in invasive Spartina alterniflora and native Suaeda salsa salt marshes in eastern China. Ecological Engineering, 97: 582-592.
DOI:10.1016/j.ecoleng.2016.10.064 |
Yuan H W, Chen J F, Ye Y, et al. 2017. Sources and distribution of sedimentary organic matter along the Andong salt marsh, Hangzhou Bay. Journal of Marine Systems, 174: 78-88.
DOI:10.1016/j.jmarsys.2017.06.001 |
Zhang J, Wu Y, Jennerjahn T C, et al. 2007. Distribution of organic matter in the Changjiang (Yangtze River) Estuary and their stable carbon and nitrogen isotopic ratios: implications for source discrimination and sedimentary dynamics. Marine Chemistry, 106(1-2): 111-126.
DOI:10.1016/j.marchem.2007.02.003 |
Zhang Y L, Du J Z, Zhao X, et al. 2014. A multi-proxy study of sedimentary humic substances in the salt marsh of the Changjiang Estuary, China. Estuarine, Coastal and Shelf Science, 151: 295-301.
DOI:10.1016/j.ecss.2014.10.007 |
Zhao B, Yao P, Li D, et al. 2021. Effects of river damming and delta erosion on organic carbon burial in the Changjiang Estuary and adjacent East China Sea inner shelf. Science of the Total Environment, 793: 148610.
DOI:10.1016/j.scitotenv.2021.148610 |
Zhou J L, Wu Y, Zhang J, et al. 2006. Carbon and nitrogen composition and stable isotope as potential indicators of source and fate of organic matter in the salt marsh of the Changjiang Estuary, China. Chemosphere, 65(2): 310-317.
DOI:10.1016/j.chemosphere.2006.02.026 |