 2023, Vol. 41
Institute of Oceanology, Chinese Academy of Sciences
Article Information
- JIANG Tao, QIN Xiaohan, WU Guannan, ZHAO Huaxian, YU Xiaotao, XIAO Xueyan, LIU Wenjing, HU Qingjing, CHEN Jufa, LI Nan
- Distribution of chromophytic phytoplankton in the Western Subarctic Gyre of Pacific Ocean revealed by morphological observation and rbcL gene sequences
- Journal of Oceanology and Limnology, 41(6): 2166-2179
- http://dx.doi.org/10.1007/s00343-022-2197-8
Article History
- Received Apr. 19, 2022
- accepted in principle Aug. 22, 2022
- accepted for publication Oct. 15, 2022


2 Key Laboratory of Sustainable Development of Marine Fisheries, Ministry of Agriculture, Yellow Sea Fisheries Research Institute, Chinese Academy of Fishery Sciences, Qingdao 266071, China;
3 Key Laboratory of Ministry of Education for Environment Change and Resources Use in Beibu Gulf, Guangxi Key Laboratory of Earth Surface Processes and Intelligent Simulation, Nanning Normal University, Nanning 530001, China;
4 State Key Laboratory of Acoustics, Institute of Acoustics, Chinese Academy of Sciences, Beijing 100190, China;
5 School of Medicine, Yunnan University, Kunming 650091, China;
6 College of Ocean and Meteorology, Guangdong Ocean University, Zhanjiang 524088, China
The subarctic North Pacific is characterized by high nutrient and low chlorophyll (HNLC) (Liu et al., 2004). The Western Subarctic Gyre (WSG) is one of the two gyre systems (the other one is the Alaskan Gyre) in the subarctic North Pacific, which exhibits some distinctive differences in oceanographic and biogeochemical processes (Harrison et al., 2004). Early studies suggested that the low Chl-a concentration is supposed to be depressed by Fedeficiency, as well as grazing pressure, in this sea area (Nishioka et al., 2003; Harrison et al., 2004). However, recent studies revealed that primary productivity and phytoplankton biomass were also limited by light availability, especially during winter (Fujiki et al., 2014; Matsumoto et al., 2014). In the last a few decades, research focused on the WSG to reveal the temporal and spatial variabilities of phytoplankton community and biomass, as well as the related influencing environmental factors (e.g., reviews of Harrison et al., 2004 and Liu et al., 2004).
Obayashi et al. (2001) proposed a double-layered structure comprising the "basic structure" and "extra diatom population" in the northern North Pacific. The basic structure comprises the non-diatoms, including prymnesiophytes, green algae and the others, and diatoms below certain levels (< 0.12 μg/L). Several studies also observed the seasonal diatom blooms from late spring to summer (Obayashi et al., 2001; Imai et al., 2002; Fujiki et al., 2022). Nevertheless, the phytoplankton community structure showed obvious differences among different seasons, and even in the same season among different studies (Suzuki et al., 2002; Fujiki et al., 2009, 2014). Fujiki et al. (2009) showed that although diatoms, prymnesiophytes, and pelagophytes are the first three important components of the phytoplankton community in the whole year, the dominant component shifted from diatoms to prymnesiophytes from summer to autumn in the WSG. Furthermore, prasinophytes were observed as the dominant phytoplankton assemblages in this area during the summer of 1999 (Suzuki et al., 2002).
At present, phytoplankton assemblages in WSG have been studied using various traditional taxonomic methods (e.g., microscopic observation and flow cytometry) (e.g., Taylor and Waters, 1982; Fujiki et al., 2009; Kwak et al., 2014; Waga et al., 2022). However, due to the lack of distinguishing characteristics of small-sized phytoplankton and the limitation of microscope resolution, only the large phytoplanktons (> ~10 μm, such as diatoms and dinoflagellates) were identified and counted (e.g., Taylor and Waters, 1982; Fujiki et al., 2009). Recently, studies based on scanning electron microscopy (SEM) observation suggested that small phytoplankton (< 10 μm), such as coccolithophorids, Parmales, and some pennate diatoms, may be more numerous than the large algal assemblages in this area (Hattori et al., 2004; Komuro et al., 2005). However, the taxonomic information and driving forces of phytoplankton community of WSG, particularly pico-phytoplankton, are still largely unclear.
In recent years, molecular tools have been widely used to identify phytoplankton species in cultured and natural samples and hence have revolutionized our knowledge of the general patterns underlying variations in the biodiversity of phytoplankton community across spatial and temporal scales. For example, rbcL genes, which encoded a large subunit of Ribulose-1, and 5-bisphosphate carboxylase/oxygenase (RuBisCO) enzyme have been used extensively and have provided increased resolution for the assessments of biodiversity on the marine phytoplankton across different marine environments (Xu and Tabita, 1996; Li et al., 2016; Pujari et al., 2019). The information on the molecular composition of phytoplankton is still limited in the WSG, thereby suggesting a significant knowledge gap in understanding the distribution of the algal community.
Therefore, in this study, multiple detecting methods, including microscopic observation, flow cytometry, and rbcL gene based on high-throughput sequencing, are selected to explore large- and small-sized phytoplankton in the WSG. We aimed to (ⅰ) explore spatial variations in the community profile of phytoplankton, (ⅱ) identify the controlling factors that influence the assembly of planktonic species in the WSG, and (ⅲ) discuss the advantage and disadvantage of current planktonic study methods from classic conventional technique to modern molecular method.
2 METHOD AND MATERIAL 2.1 Site description and sampling methodFrom May 29 to July 30, 2020, we conducted the field investigation in the WSG of the Northwest Pacific Ocean (41°11′24″N–48°6′9″N, 162°15′52″E–169°34′9″E) by the saury fishing vessel Minghualun. According to the navigation track of the fishing vessel, 25 stations were randomly set up (Sts. W1–W25 are listed in chronological order) basically in the order from south to north (Fig. 1). Supplementary Table S1 presents the sampling time, longitude, latitude, and environmental parameters of each station.

|
| Fig.1 The study region and sampling stations in the WSG of the Northwest Pacific Ocean OC: Oyashio Current; KE: Kuroshio Current Extension; SC: Subarctic Current; AS: Alaska Stream. |
Temperature and salinity were measured using an SBE-37 MicroCAT recorder (Seabird Electronics, Inc., Washington, USA). Water samples were collected at the depth layer of 10 m by using a Niskin water sampler (5 L). A 300-mL seawater filtered by GF/F membranes (0.7 μm, Whatman) was stored at -20-℃ freezer for nutrient analysis. An aliquot of 1-L water sample was fixed by acid Lugol's solution for the microscopic identification of phytoplankton assemblages. For molecular analysis, 2.0-L seawater was filtered on 0.45-μm pore-size polycarbonate membrane (47 mm, Millipore Corp., Billerica, MA, United States). Then, the filters were stored in liquid nitrogen until DNA extraction was performed. Moreover, the water samples were stored in 2-mL cryotubes with paraformaldehyde concentration of 2% and placed in liquid nitrogen for later pico-plankton analysis by flow cytometer.
2.2 Nutrient analysisTriplicate samples of 100-mL seawater for analysis of nitrate (NO3–), nitrite (NO2–), ammonium (NH4+), dissolved reactive phosphorous (DIP), and dissolved silicate (DSi) were filtered through GF/F filters. The filtrate was stored at -20-℃ freezer until analysis. Dissolved inorganic nitrogen (DIN) refers to the sum of the NO3–, NO2–, and NH4+ contents. A Skalar San++ continuous flow analyzer analyzed the concentrations of these nutrients (Strickland and Parsons, 1972).
2.3 Analysis of phytoplankton and pico-plankton by microscopy and flow cytometerThe fixed water samples by Lugol's solution were concentrated to 5–10 mL by settling for > 48 h. Identification and counting were performed under an inverted microscope (OLYMPUS BX51, Japan) according to the method of Utermöhl (1958). Only phytoplankton cells with size > 10 μm were counted in this study because the smaller ones were difficult to identify.
Pico-plankton analysis was conducted using a FACSCalibur Flow Cytometer (Becton Dickinson, BD Biosciences, USA), as described by Jiang et al. (2016). The pico-plankton abundance was determined by flow cytometry excited with blue argon (488 nm) and red diode (635 nm) lasers. Moreover, four filters for fluorescent emission (i.e., FL1 (530/30 BP), FL2 (585/42 BP), FL3 (670 LP), and FL4 (661/16 BP)) were used.
2.4 DNA extraction, PCR amplification, and high-throughput sequencingEnvironmental DNA on 0.45-μm pore size polycarbonate membrane was extracted using a DNeasy Power Water Kit (QIAGEN, USA) according to the manufacturer's protocols and stored at -80 ℃. Each sample was extracted in triplicates. Previously published primers (F: 5′-GATGATGARAAYATTAACTC-3′ and R: 5′-ATTT GDCCACAGTGDATACCA-3′) (John et al., 2007) were used to amplify the form of ID rbcL gene fragment (550 bp). Each 20-μL reaction mixture comprised 0.25 μL (5 units) of EX Taq (TaKaRa, Dalian, China), 0.2 μL of each primer (20 μmol/L), 1 μL of environmental DNA (20–30 ng), and 18.35 μL of sterile distilled water. PCR reaction was performed as follows: initial denaturation at 95 ℃ for 5 min, 30 cycles of 95 ℃ for 1 min, 56 ℃ for 1 min, 72 ℃ for 1 min, and a final extension at 72 ℃ for 5 min. The qualified PCR products were prepared according to the Illumina library preparation protocols and sent to an Illumina MiSeq platform (PE300, 2×300 bp) for the paired-end sequencing at Majorbio Co., Ltd. (Shanghai, China).
2.5 Data processing and statistical analysisThe paired-end reads were joined by VSEARCH plugin in QIIME2 environment (Rognes et al., 2016). Low quality reads (quality scores < 30), sequences with length < 200 bp, primers, barcode sequences, and chimeric sequences were eliminated by QIIME2 (Bolyen et al., 2019). Then, the operational taxonomic unit (OTU) was clustered (de novo) on the basis of 97% sequence identity (Pujari et al., 2019). The taxonomic annotation of the OTUs was performed from an available rbcL sequence database generated from GenBank data using local BLASTn. The sequencing data were deposited in the NCBI BioProject database under the PRJNA825063.
To make a statistical analysis of the spatial variation of the physical, chemical, and biological factors, we divided all the stations into three regions according to their latitudinal distribution (Fig. 1). One-way ANOVA (LSD test) was used to evaluate the differences in the environmental and biological parameters among the three regions. Statistical significance was set at P < 0.05. Redundancy analysis (RDA) was performed with CANOCO 5 software to explore the relationships between environmental and biological (phytoplankton) variables.
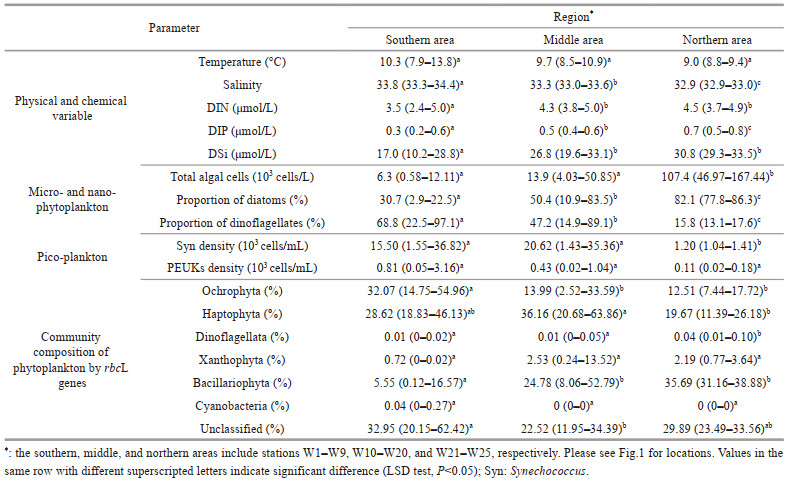
3 RESULT 3.1 Physical and chemical parametersAt 10-m depth layer of WSG during the study period, the temperature ranged from 7.9 ℃ to 13.8 ℃ with an average of 9.8 ℃, and salinity ranged from 32.9 to 34.4 with an average of 33.5. Overall, the higher salinity values were observed in the south and the lower ones in the north (Table 1). The distribution of water temperature is patchy, although the highest value appears in the south (St. W4). In contrast to salinity, the nutrients (i.e., DIN, DIP, and DSi) showed an increasing trend from south to north, despite some patchy distribution (Fig. 2; Table 1). The average concentration of DIN, DIP, and DSi was 3.96, 0.43, and 22.92 μmo/L, respectively.
|

|
| Fig.2 Distribution of physical parameters and nutrient concentration |
The phytoplankton consisted of Bacillariophyta (28 genera), Dinoflagellata (11 genera), Ochrophyta (2 genera), and Chlorophyta (1 genera) identified by microscopy. Total phytoplankton abundances ranged from 0.6×10³ to 167.4×10³ cells/L with an average of 26.1×10³ cells/L. The absolute abundance of a specific phytoplankton group was shown in Fig. 3a. The abundance of total phytoplankton showed an overall increasing trend from south to north (Fig. 3a), and the cell abundance in the northern area was significantly higher than that in the southern and middle areas (P < 0.05; Table 1). Dinoflagellates and Pennatae diatoms dominated the phytoplankton assemblages in the southern and northern stations, respectively (Fig. 3b; Table 1). The dominant taxa were Pseudo-nitzschia spp., Fragilaria spp., Scrippsiella trochoidea, Gyrodinium spirale, Nitzschia spp., Prorocentrum spp., Chaetoceros spp., Cyclotella spp., and Donkinia spp. (Supplementary Table S2). Pseudo-nitzschia was the first dominant genus, which accounted for 10.33% of the total phytoplankton cells on average (Fig. 3b; Supplementary Table S2). Fragilaria was the second dominant genus (7.62% on average). Scrippsiella (18.73% on average), Gyrodinium (16.45% on average), and Prorocentrum (7.88% on average) were the three dominant dinoflagellate genera (Fig. 3b; Supplementary Table S2).

|
| Fig.3 Spatial distribution of phytoplankton assemblages by microscopy a. absolute cell abundances of different groups; b. composition of dominant genus. Pennatae: Pseudo-nitzschia spp., Fragilaria spp., Nitzschia spp., Donkinia spp., and other Pennatae diatoms (Pennatae-others); Centricae: Chaetoceros spp., Cyclotella spp., and other Centricae (Centricae-others); Dinoflagellate: Scrippsiella trochoidea, Gyrodinium spirale, Prorocentrum spp., and other Dinoflagellates (Dinoflagellata-others). |
Flow cytometry results showed that the pico-plankton included Synechococcus and pico-eukaryotes (Fig. 4). Prochlorococcus spp. was not detected at any station. The absence of Prochlorococcus spp. was also supported by the results of rbcL genes (Figs. 5–6). The abundance of Synechococcus ranged from 0.10×10⁴ to 3.68×10⁴ cells/mL with an average of 1.57×10⁴ cells/mL. High Synechococcus abundance was confined mainly to the middle stations of the investigation area (Fig. 4a; Table 1). By comparison, pico-eukaryote abundance was relatively low, with an average of 0.52×10³ cells/mL, whereas those in the south-west of the study area showed the highest abundances (3.16×10³ cells/mL at St. W7) (Fig. 4b).

|
| Fig.4 Distribution of pico-plankton abundance a. Synechococcus (Syn); b. pico-eukaryotes (Pico-Euk). |

|
| Fig.5 Community structure of chromophytic phytoplankton at phylum based on rbcL gene sequences |

|
| Fig.6 Neighbor-joining phylogenetic tree based on rbcL amino acid sequences The neighbor-joining tree using bootstrap method (with 1 000 bootstrap replicates). Scale bar: 0.05 substitutions per site. |
A total of 5 733 244 raw sequences were obtained from the water samples of WSP, and our down steam analysis included 4 661 174 clean sequences. After clustering at a 97% similarity level, we achieved 2 095 OTUs in this study.
Major chromophytic phytoplankton groups derived from rbcL genes included Haptophyta, Bacillariophyta, Ochrophyta, as well as rarely occurring groups, such as Xanthophyta, Cyanobacteria, Dinoflagellata, Rhodophyta, and Cryptophyta (Fig. 5). At the phylum level, Haptophyta was the most abundant phylum, accounting for approximately 30.80% of the total obtained OTUs in all samples. Ochrophyta and Bacillariophyta was the second and third most abundant phylum, and its relative abundance was 20.26% and 19.60%, respectively. Unclassified phytoplankton group accounted for 27.45% on average.
The proportion of chromophytic phytoplankton groups showed a certain spatial distribution (Fig. 5; Table 1). The proportion of Ochrophyta to the total chromophytic phytoplankton in the southern area was significantly higher than those in the middle and northern areas were (P < 0.05; Table 1). The high proportion of Haptophyta occurred in the middle area (Fig. 5), which was significantly higher than that in the northern area (P < 0.05; Table 1). Moreover, the southern area showed the lowest proportion of diatoms compared with the middle and northern areas (P < 0.05) (Fig. 5; Table 1).
The neighbor-joining phylogenetic tree showed that Bacillariophyceae contained the most genera (n=26), with 79 OTUs being found. Six genera were identified as class Haptophyceae, which comprised the most diverse OTUs (n=328). Among them, Coccolithus, Chrysochromulina, and Haptolina were dominant at most of the stations. With regard to Dictyochophyceae, it included two genera, which were dominated by Florenciella. Bolidophyceae only contained 10 OTUs (i.e., Triparma), which mainly dominated in the southern sea area (e.g., W1, 5, 7, 8) (Fig. 6).
3.5 Influence of environmental parameters on phytoplankton assemblagesRDA was conducted to determine the response of phytoplankton assemblages to environmental parameters (Fig. 7). Temperature, salinity, and nutrients (DIN, DIP, DSi) were assigned as environmental parameters. The composition of phytoplankton assemblages (%) identified by microscopic counting and rbcL genes and pico-plankton abundances (Synechococcus and pico-eukaryotes) were assigned as biological parameters. The cumulative contribution of the first two axes to the relationship between the phytoplankton assemblages and environment factors was 92.5%. RDA showed that high proportion of diatoms (e.g., microscopic and rbcL method) was positively correlated with nutrients (DIN, DIP, and DSi) and negatively correlated with temperature and salinity at the first axis. The proportion of Ochrophyta, Rhodophyta, and cyanobateria identified by rbcL genes was positively correlated with salinity and temperature and showed negative correlation to nutrients (Fig. 7). Synechococcus abundance determined by cytometry did not show any relationship with temperature, salinity, and nutrients because those existed in the central stations of the investigation area (Figs. 4 & 7).

|
| Fig.7 Relationship of phytoplankton species with environmental variables in the WSG by RDA analysis Environmental parameters include T, S, DIN, DIP, DSi, Syn (Synechococcus), and Pico-Euk (pico-eukaryotes). Biological parameters include Bacil (Bacillariophyta), P-Bacil (Pennatae diatoms), C-Bacil (Centricae diatoms), Ochro (Ochrophyta), Rhodo (Rhodophyta), Dinof (Dinoflagellata), Crypt (Cryptophyta), Chlor (Chlorophyta), Cyano (Cyanobateria, i.e., Synechococcus), Hapto (Haptophyta), Uncla (unclassified groups), and Xanth (Xanthophyta). Notably, the phytoplankton composition identified by microscope was marked with solid blue circle and those by rbcL genes done with open triangle. |
Our results, as well as those of former studies, proved that the abundances of small (pico- and nano-) phytoplankton are higher than those of the large (> 10 μm) phytoplankton in the WSG, even in the whole subarctic Pacific (Liu et al., 2002a, b; Fujiki et al., 2009). The abundance of Synechococcus in surface seawater was comparable with the results of Liu et al. (2002a, b) and Fujiki et al. (2009). Prochlorococcus spp. was not observed in the study area (also see Liu et al., 2002b and Fujiki et al., 2009) although it has been reported to occur as far north as 60°N in the North Atlantic (Buck et al., 1996). The absence of Prochlorococcus spp. in the WSG water might be ascribed for the lower sea surface temperature and salinity in the subarctic North Pacific water than in the North Atlantic (Liu et al., 2002b). Picoeukaryote abundance was about an order of magnitude below Synechococcus in the present study and was much lower than that of the previous studies (Liu et al., 2002a, b). However, only few studies are based on cytometric counting in this area, and it is not clear whether there is a long-term evolution trend of picoeukaryote.
With regard to large-sized (> 10 μm) phytoplankton assemblages, diatoms are usually the dominant group in the subarctic Pacific in our 2020 phytoplankton composition data, as well as those in previous studies (Taylor and Waters, 1982; Mochizuki et al., 2002; Aizawa et al., 2005; Giesbrecht et al., 2019). Consistent with the results of Aizawa et al. (2005) in 1999, we found that the dominant species of diatoms mainly included the Pennate diatoms, such as Pseudo-nitzschia spp., Fragilariopsis spp., and Nitzschia spp. In comparison, centric diatoms dominate the phytoplankton assemblages at station KNOT of the WSG all year round (Mochizuki et al., 2002). The above results show that the diatom population in the sea area presents some temporal and spatial variation characteristics. However, these limited investigations cannot provide a clear conclusion at present.
Aizawa et al. (2005) described the distribution of diatom abundances in the North West Pacific during summer and showed that the subarctic marginal seas had much higher values than the subtropical temperate waters to the south. Our results strongly support this general picture, with most of our northward subarctic samples containing 103–105 cells/L diatoms but with a significant drop (102–103 cells/L) in absolute abundance in the southern waters (Table 1). The relatively high phytoplankton abundances in the northern waters suggested that subarctic waters were productive under the influence of high nutrient concentrations (Aizawa et al., 2005), as described in Section 4.3. Although the abundance of dinoflagellates increased from south to north, their proportion in total phytoplankton decreased, which might be ascribed to the nutrient strategy of dinoflagellates, of which, some species are non-photosynthetic and heterotrophic in this area (Taylor and Waters, 1982).
4.2 Phytoplankton composition revealed by rbcL genesPrevious studies showed that no single phytoplankton group absolutely dominated the phytoplankton assemblages in the WSG (Suzuki et al., 2002; Liu et al, 2004; Fujiki et al., 2009, 2014). The current study showed that major chromophytic groups included Haptophyta, Bacillariophyta, and Ochrophyta, and less abundant groups, such as Xanthophyta, Cyanobacteria, Dinoflagellata, Rhodophyta, and Cryptophyta. Haptophycea was the predominant phytoplankton group retrieved from the rbcL genes, which contained three dominant genus, including Coccolithus, Chrysochromulina, and Haptolina (previously regarded as a synonym of Chrysochromulina). Given that phytoplankton does not have characterization at the molecular level in the WSG, morphological analysis by SEM in the previous studies (Hattori et al., 2004; Komuro et al., 2005) supported our observation of Haptophyta by rbcL genes. Those studies showed that Emiliania huxleyi var. huxleyi and Coccolithus pelagicus f. pelagicus were the most abundant taxon of coccolithophores in the western subarctic Pacific (Taylor and Waters, 1982; Hattori et al., 2004). Interestingly, Chrysochromulina and Haptolina were rarely reported in the WSG (Hattori et al., 2004; Komuro et al., 2005). Some Chrysochromulina species can produce toxins and form toxic algal blooms under certain conditions in Scandinavian waters, which are harmful to marine animals and have caused massive mortalities of wild and cultured fish (e.g., salmon) in Scandinavian waters (Karlson et al., 2021). Taylor and Waters (1982) showed that the main contributor to the 3.5–8-μm phytoplankton assemblages was Phaeocystis pouchetti (Hariot) Lagerh. in the subarctic North Pacific Ocean, which was also identified in our results although its proportion to total phytoplankton was quite low. Phaeocystis spp. are small-celled (2–7 μm) and bloom-forming prymnesiophytes (haptophyta), which are found all over the world (Karlson et al., 2021). Blooms of Phaeocystis are considered a nuisance because of their potential for various harmful impacts on the ecosystem (Karlson et al., 2021), which deserves further attention in this area.
Ochrophyta was the second most abundant phylum identified by rbcL genes. The order Parmales are a group of pico-sized marine protists with cells surrounded by silica plates (Ichinomiya et al., 2011). Ichinomiya et al. (2011) showed that a culture strain of the Parmales species Triparma laevis, isolated from the western North Pacific off Japan, was grouped with the Bolidophyceae by 18S rRNA and rbcL gene sequences. Bolidophyceae (Parmales) were ubiquitously distributed but only constituted a minor component of the phytoplankton community in the marine environment (Ichinomiya et al., 2016). However, Komuro et al. (2005) showed that Parmales are the dominant phytoplankton group analyzed by SEM at Station KNOT, in the south-west of the WSG. Similar to Pujari et al. (2019), our results suggested that the rbcL sequences of Parmales (Triparma) shared high similarity (97%) with Bacillariophyceae ones and approximately accounted to 3.59% of the total identified chromophytic phytoplankton by rbcL genes (Fig. 6).
Dictyochophyceae, which had not been reported in the previous studies by the morphological observation, were also an important phytoplankton group in the study area (e.g., Hattori et al., 2004; Komuro et al., 2005; Ichinomiya et al., 2011). The occurrence of Florenciella parvula was observed in Antarctic, North Atlantic, and Mediterranean Sea by SSU rDNA, which suggested that Florenciella could be important components of the pico-phytoplankton in polar and temperate ecosystems (Eikrem et al., 2004). Amplicon sequencing (18S rDNA) suggests that Florenciella accounts for up to 10% of eukaryotes ≤3 μm and is one of the abundant groups in the North Pacific Subtropical Gyre (Rii et al., 2018). Two species of Pseudochattonella were described (i.e., P. farcimen and P. verruculosa) (https://www.algaebase.org/). Pseudochattonella spp. has been widely observed on a global scale, including in the coastal waters of New Zealand (MacKenzie et al., 2011) and Chile (Mardones et al., 2019). Fish-killing Pseudochattonella blooms in the northern Europe have a multidecadal history. For example, the recurrent extensive Pseudochattonella blooms have caused large fish mortalities in the Kattegat and Skagerrak (Karlson et al., 2021). More attention should be paid to this genus in the WSG, which is an important fishing ground for saury.
Diatoms (Bacillariophyta) was the third dominant phytoplankton phylum in the WSP revealed by rbcL genes. Bacillariophyta was proven the most predominant phylum in the coastal and nearshore sea areas (Liu et al., 2006; Samanta and Bhadury, 2014; Li et al., 2016). Nevertheless, combined with the previous studies, our result further showed that diatoms contained the most diverse genera in the WSG, as well as in different oceanic and nearshore areas around the world (Li et al., 2013; Samanta and Bhadury, 2014; Pujari et al., 2019, 2021).
4.3 Comparison of phytoplankton community structure between morphological observation and rbcL gene sequencesMicroscopic observation and rbcL gene sequences showed that diatoms are the most diverse taxa in the study area (Fig. 6; Supplementary Table S2). Nevertheless, rbcL genes seemed to recover much more numbers of diatom species than the microscopic observation. Similar results were also found in the Bengal Bay (Pujari et al., 2019). One possible explanation was that small-sized diatoms (< 10 μm), such as Minutocellus spp. and Diatoma spp., might contribute to multiple copies of rbcL genes (Pujari et al., 2019). Furthermore, some discrepancies existed for the composition of diatoms between both methods. For example, the Pennatae diatoms Pseudonitzschia, Fragilariopsis, and Nitzschia were the co-dominant diatom taxon by microscopic counting while only Nitzschia showed high proportion of the total phytoplankton recovered by rbcL genes (Figs. 3 & 6). Microscopic method uses cells as the counting units, whereas molecular method utilizes gene numbers as statistical units. The gene copy number of rbcL gene may vary from species to species, making the recovered phytoplankton community structure different from the microscopic counting (Liu et al., 2006).
The molecular characterization of rbcL genes seemed to underestimate the contribution of dinoflagellate significantly. This was also corroborated by Pujari et al. (2019), who found only peridinium using the rbcL genes while cell abundance of dinoflagellates shared similar levels with diatoms in the Bay of Bengal. Furthermore, dinoflagellates were also rarely recovered by rbcL genes in different sea regions from nearshore to open sea in the previous studies (e.g., Samanta and Bhadury, 2014, 2016; Pujari et al., 2021). However, among the dinoflagellates, only Dinophysis and Galeidinium, which were not observed by microscopic observation, presumably due to their low cell density or small size or cell disruption under the fixation of Lugol's solution, were identified. This study showed that Dinophysis was symbiotic with Cryptophyceae (Fig. 6). Dinophysis species contained plastids of cryptophyte origin transferred from cryptophyte-ciliate-Dinophysis food chain (Park et al., 2006). Dinophysis and Cryptophyceae were subclustered together in the phylogenetic tree also being observed by Samanta and Bhadury (2014). The underestimation of dinoflagellate biomass could be ascribed for the fact that RuBisCO in dinoflagellates was possibly encoded by RuBisCO form Ⅱ instead of form Ⅰ, and dinoflagellates RuBisCO were perhaps encoded by genomic DNA and not by chloroplast DNA (Morse et al., 1995). This finding emphasized the importance of a combined analysis of phytoplankton assemblages by molecular and microscopy method in the natural marine environment, especially in the WSG, because high abundance of dinoflagellates existed during the study period.
Synechococcus showed quite low proportion of the total chromophytic phytoplankton recovered by rbcL genes in this study (Fig. 6). By comparison, Suzuki et al. (2002) showed that Synechococcus contributed a high proportion to total Chl a revealed by HPLC-pigment analysis in the WSG. We also noticed that Synechococcus presented quite low proportion by rbcL genes in the Bay of Bengal (Pujari et al., 2019). This result indicated that rbcL genes might greatly underestimate the contribution of Synechococcus to the total phytoplankton, and further study should be made in the future.
Generally, conventional microscopic observations for phytoplankton analysis are time consuming and partly subjective, especially, small nano- and picoplanktonic cells are difficult to identify at the species level (Eiler et al., 2013). High-throughput sequencing technologies can avoid these drawbacks and provide promising potential for the rapid automated examination of environmental samples through uncultivated method. However, the taxonomic resolution for phytoplankton at species level using rbcL genes is scattered because of the lack of broad-range PCR primers and classified sequences in the databases (Bradley et al., 2016). To the best of our knowledge, our results serve as the first report based on functional genes (i.e., rbcL) to reveal the community structures of chromophytic phytoplankton and provide baseline of phytoplankton community for future studies in the WSG. Nevertheless, the use of conventional technique of microscopic identification is still necessary to identify phytoplankton at genus/species level. Moreover, the flow cytometry method is fast and batch, good at studying long-term changes of picoplankton, and mainly used to analyze picoplankton abundance effectively. However, it has a relatively limited ability to identify phytoplankton taxonomic information. Therefore, it is very meaningful to explore and understand the phytoplankton population structure and distribution in the WSG comprehensively by using morphological and molecular methods.
4.4 Influence of environmental factors on the spatial distribution of phytoplankton assemblagesRoden (1991) emphasized that the climatological mean positions of the subarctic-subtropical transition zone boundaries were at latitudes 32°N and 42°N. According to Roden (1991), the study area was mainly governed by the subarctic waters and the subarctic frontal zones because the southern stations (at latitudes 40°N and 42°N) faced salinity of > 34 and low nutrient concentration. Furthermore, the mesoscale perturbations often dominate this area, which caused the patches of surface temperature and salinity, as well as nutrients. Nevertheless, the northern stations of the study area (northward of about 44°N) seemed to be governed by the subarctic waters with the salinity < 33.5 and temperature < 11 ℃ (Fig. 2) (Roden, 1991).
Previous studies demonstrated that, in the surface seawater of the WSG, nutrient concentration varied seasonally with the lowest values occurring during the summer (June–August) (Tsurushima et al., 2002). With stratification increasing in summer, nutrients become depleted and the production of diatoms declines, which is in favor of the growth of flagellates (Uitz et al., 2010). Our results furtherly proved that the contribution of diatoms to total phytoplankton biomass is less than that of flagellates in the WSG especially in the southern stations (Figs. 5–6). Nutrients (especially DIN) were relatively low compared with the former studies (Fujiki et al., 2009, 2014). Similarly, low concentrations of nutrients and Chl a were also observed in the surface layer (20 m) of WSG during summer of 2010 by Kwak et al. (2014). Those authors suggested that exhaustion of nitrate by phytoplankton appears to limit the primary productivity in the subsurface layer during the summer period (Kwak et al., 2014).
The spatial distribution of different phytoplankton groups/species was observed in the study area, which indicated that the phytoplankton community composition in surface waters varied with environmental conditions in the subarctic Pacific (Giesbrecht et al., 2019). The abundance of diatoms increased obviously from south to north, likely due to the increase in nutrients in the subarctic waters. Furthermore, the dominance of flagellates (e.g., Ochrophyta) in the southern waters can be explained by the differences in the water mass composition and lower nutrient content in comparison with the northern waters (Nishioka et al., 2021). Diatoms need nutrient-rich conditions for growth owing to their relatively low surface-to-volume ratios (Sarthou et al., 2005), whereas the flagellates (especially the small-sized silicoflagellates) can dominate in the oligotrophic waters because of their mixtrophic nutrient strategy and lower nutrient half-saturation constants (Ks) than diatoms (Uitz et al., 2010; Giesbrecht et al., 2019).
Fe limit was supposed to be the main environmental factor that controls the primary productivity in the north-west sub-Arctic Pacific (Liu et al., 2004; Fujiki et al., 2022). Fujiki et al. (2014) found that the dominant phytoplankton group shifted from diatoms to prymnesiophytes after the diatom blooms as the latter has a lower Fe demand than the former. Mixotrophy may also provide flagellates a competitive advantage over the purely phototrophic phytoplankton groups (e.g., diatoms) when nutrients are limiting in the surrounding environment (Liu et al., 2009). A recent study by Nishioka et al. (2020) showed that Fe concentration was positively with N concentration in the north-west sub-Arctic Pacific, and the former played a more important role in stimulating diatom blooms than the macro-nutrients (i.e., N and P) (Nishioka et al., 2011). This may be another reason why the abundance and proportion of diatoms in the northern region are significantly higher than those in the southern region. However, Fe concentration was not determined in this study and hence deserved further attention in the future.
5 CONCLUSIONOur observation revealed the diversity of phytoplankton and their distribution in the WSG by microscopic method and rbcL gene analysis. Environmental variables, including temperature, salinity, and nutrients, are important factors that influence the distribution of phytoplankton assemblages. The microscopic method revealed that the total phytoplankton abundances (mainly Bacillariophyta and Dinoflagellata) showed an increasing trend from south to north, and dinoflagellates and Pennatae diatoms dominated the phytoplankton assemblages in the southern and northern stations, respectively. The relatively high phytoplankton abundances in the northern waters suggested that the subarctic waters were productive under the influence of high nutrient concentrations. Compared with the microscopic method, the rbcL gene analysis revealed much higher diversity of phytoplankton assemblages in the study area. Major chromophytic phytoplankton groups derived from rbcL genes included Haptophyta, Ochrophyta, and Bacillariophyta, of which, the two former dominated the phytoplankton assemblages in the southern oligotrophic waters whereas the contribution of Bacillariophyta increased greatly in the north. The molecular characterization of rbcL genes seemed to underestimate the contribution of dinoflagellate, as well as Synechococcus, significantly. A combination of morphological observation and rbcL gene sequences is necessary, which provides a comprehensive understanding of phytoplankton assemblages in the study area.
6 DATA AVAILABILITY STATEMENTThe datasets generated and/or analyzed during the current study are available from the corresponding author on reasonable request.
7 ACKNOWLEDGMENTThe authors would like to thank Mr. Zuqiang LIU from Yellow Sea Fisheries Research Institute, Chinese Academy of Fishery Sciences and all the staffs of "Minghualun" for assistance in field investigation and sample analysis.
Electronic supplementary material
Supplementary material (Supplementary Tables S1 & S2) is available in the online version of this article at https://doi.org/10.1007/s00343-022-2197-8/.
Aizawa C, Tanimoto M, Jordan R W. 2005. Living diatom assemblages from North Pacific and Bering Sea surface waters during summer 1999. Deep Sea Research Part Ⅱ: Topical Studies in Oceanography, 52(16-18): 2186-2205.
DOI:10.1016/j.dsr2.2005.08.008 |
Bolyen E, Rideout J R, Dillon M R, et al. 2019. Reproducible, interactive, scalable and extensible microbiome data science using QIIME 2. Nature Biotechnology, 37(8): 852-857.
DOI:10.1038/s41587-019-0209-9 |
Bradley I M, Pinto A J, Guest J S. 2016. Design and evaluation of Illumina MiSeq-compatible, 18S rRNA gene-specific primers for improved characterization of mixed phototrophic communities. Applied and Environmental Microbiology, 82(19): 5878-5891.
DOI:10.1128/AEM.01630-16 |
Buck K R, Chavez F P, Campbell L. 1996. Basin-wide distributions of living carbon components and the inverted trophic pyramid of the central gyre of the North Atlantic Ocean, summer 1993. Aquatic Microbial Ecology, 10(3): 283-298.
|
Eikrem W, Romari K, Latasa M, et al. 2004. Florenciella parvula gen. et sp. nov. (Dictyochophyceae, Heterokontophyta), a small flagellate isolated from the English Channel. Phycologia, 43(6): 658-668.
DOI:10.2216/i0031-8884-43-6-658.1 |
Eiler A, Drakare S, Bertilsson S, et al. 2013. Unveiling distribution patterns of freshwater phytoplankton by a next generation sequencing based approach. PLoS One, 8(1): e53516.
DOI:10.1371/journal.pone.0053516 |
Fujiki T, Hosoda S, Harada N. 2022. Phytoplankton blooms in summer and autumn in the northwestern subarctic Pacific detected by the mooring and float systems. Journal of Oceanography, 78(2): 63-72.
DOI:10.1007/s10872-021-00628-z |
Fujiki T, Matsumoto K, Honda M C, et al. 2009. Phytoplankton composition in the subarctic North Pacific during autumn 2005. Journal of Plankton Research, 31(2): 179-191.
DOI:10.1093/plankt/fbn108 |
Fujiki T, Matsumoto K, Mino Y, et al. 2014. Seasonal cycle of phytoplankton community structure and photophysiological state in the western subarctic gyre of the North Pacific. Limnology and Oceanography, 59(3): 887-900.
DOI:10.4319/lo.2014.59.3.0887 |
Giesbrecht K E, Varela D E, Wiktor J, et al. 2019. A decade of summertime measurements of phytoplankton biomass, productivity and assemblage composition in the Pacific Arctic Region from 2006 to 2016. Deep Sea Research Part Ⅱ: Topical Studies in Oceanography, 162: 93-113.
DOI:10.1016/j.dsr2.2018.06.010 |
Harrison P J, Whitney F A, Tsuda A, et al. 2004. Nutrient and plankton dynamics in the NE and NW Gyres of the Subarctic Pacific Ocean. Journal of Oceanography, 60(1): 93-117.
DOI:10.1023/B:JOCE.0000038321.57391.2a |
Hattori H, Koike M, Tachikawa K, et al. 2004. Spatial variability of living coccolithophore distribution in the western subarctic Pacific and western Bering Sea. Journal of Oceanography, 60(2): 505-515.
DOI:10.1023/B:JOCE.0000038063.81738.ab |
Ichinomiya M, Dos Santos A L, Gourvil P, et al. 2016. Diversity and oceanic distribution of the Parmales (Bolidophyceae), a picoplanktonic group closely related to diatoms. The ISME Journal, 10(10): 2419-2434.
DOI:10.1038/ismej.2016.38 |
Ichinomiya M, Yoshikawa S, Kamiya M, et al. 2011. Isolation and characterization of Parmales (Heterokonta/Heterokontophyta/Stramenopiles) from the Oyashio region, Western North Pacific. Journal of Phycology, 47(1): 144-151.
DOI:10.1111/j.1529-8817.2010.00926.x |
Imai K, Nojiri Y, Tsurushima N, et al. 2002. Time series of seasonal variation of primary productivity at station KNOT (44°N, 155°E) in the sub-arctic western North Pacific. Deep Sea Research Part Ⅱ: Topical Studies in Oceanography, 49(24-25): 5395-5408.
DOI:10.1016/S0967-0645(02)00198-4 |
Jiang T, Chai C, Wang J F, et al. 2016. Temporal and spatial variations of abundance of phycocyanin- and phycoerythrin-rich Synechococcus in Pearl River Estuary and adjacent coastal area. Journal of Ocean University of China, 15(5): 897-904.
DOI:10.1007/s11802-016-3011-z |
John D E, Patterson S S, Paul J H. 2007. Phytoplankton-group specific quantitative polymerase chain reaction assays for RuBisCO mRNA transcripts in seawater. Marine Biotechnology, 9(6): 747-759.
DOI:10.1007/s10126-007-9027-z |
Karlson B, Andersen P, Arneborg L, et al. 2021. Harmful algal blooms and their effects in coastal seas of northern Europe. Harmful Algae, 102: 101989.
DOI:10.1016/j.hal.2021.101989 |
Komuro C, Narita H, Imai K, et al. 2005. Microplankton assemblages at Station KNOT in the subarctic western Pacific, 1999-2000. Deep Sea Research Part Ⅱ: Topical Studies in Oceanography, 52(16-18): 2206-2217.
DOI:10.1016/j.dsr2.2005.08.006 |
Kwak J H, Lee S H, Hwang J, et al. 2014. Summer primary productivity and phytoplankton community composition driven by different hydrographic structures in the East/Japan Sea and the Western Subarctic Pacific. Journal of Geophysical Research: Oceans, 119(7): 4505-4519.
DOI:10.1002/2014jc009874 |
Li B L, Karl D M, Letelier R M, et al. 2013. Variability of chromophytic phytoplankton in the North Pacific Subtropical Gyre. Deep Sea Research Part Ⅱ: Topical Studies in Oceanography, 93: 84-95.
DOI:10.1016/j.dsr2.2013.03.007 |
Li N, Yu S X, Wang Y C, et al. 2016. Diversity of phototrophic phytoplankton in Northern South China Sea indicated by rbcL analysis. Journal of Applied Phycology, 28(2): 773-781.
DOI:10.1007/s10811-015-0624-3 |
Liu H, Probert I, Uitz J, et al. 2009. Extreme diversity in noncalcifying haptophytes explains a major pigment paradox in open oceans. Proceedings of the National Academy of Sciences of the United States of America, 106(31): 12803-12808.
DOI:10.1073/pnas.0905841106 |
Liu H B, Imai K, Suzuki K, et al. 2002a. Seasonal variability of picophytoplankton and bacteria in the western subarctic Pacific Ocean at station KNOT. Deep Sea Research Part Ⅱ: Topical Studies in Oceanography, 49(24-25): 5409-5420.
DOI:10.1016/S0967-0645(02)00199-6 |
Liu H B, Suzuki K, Minami C, et al. 2002b. Picoplankton community structure in the subarctic Pacific Ocean and the Bering Sea during summer 1999. Marine Ecology Progress Series, 237: 1-14.
DOI:10.3354/meps237001 |
Liu H B, Suzuki K, Saito H. 2004. Community structure and dynamics of phytoplankton in the western subarctic Pacific Ocean: a synthesis. Journal of Oceanography, 60(1): 119-137.
DOI:10.1023/B:JOCE.0000038322.79644.36 |
Liu Y J, Yang G P, Guan X J, et al. 2006. Genetic diversity and its seasonal variation of jiaozhou bay phytoplankton determined by rbcL gene sequencing. Acta Oceanologica Sinica, 25(2): 125-134.
|
Mackenzie L A, Smith K F, Rhodes L L, et al. 2011. Mortalities of sea-cage salmon (Oncorhynchus tshawytscha) due to a bloom of Pseudochattonella verruculosa (Dictyochophyceae) in Queen Charlotte Sound, New Zealand. Harmful Algae, 11: 45-53.
DOI:10.1016/j.hal.2011.07.003 |
Mardones J I, Fuenzalida G, Zenteno K, et al. 2019. Salinity-growth response and ichthyotoxic potency of the Chilean Pseudochattonella verruculosa. Frontiers in Marine Science, 6: 24.
DOI:10.3389/fmars.2019.00024 |
Matsumoto K, Honda M C, Sasaoka K, et al. 2014. Seasonal variability of primary production and phytoplankton biomass in the western pacific subarctic gyre: control by light availability within the mixed layer. Journal of Geophysical Research: Oceans, 119(9): 6523-6534.
DOI:10.1002/2014JC009982 |
Mochizuki M, Shiga N, Saito M, et al. 2002. Seasonal changes in nutrients, chlorophyll a and the phytoplankton assemblage of the western subarctic gyre in the Pacific Ocean. Deep Sea Research Part Ⅱ: Topical Studies in Oceanography, 49(24-25): 5421-5439.
DOI:10.1016/S0967-0645(02)00209-6 |
Morse D, Salois P, Markovic P, et al. 1995. A nuclear-encoded form Ⅱ RuBisCO in dinoflagellates. Science, 268(5217): 1622-1624.
DOI:10.1126/science.7777861 |
Nishioka J, Hirawake T, Nomura D, et al. 2021. Iron and nutrient dynamics along the East Kamchatka Current, western Bering Sea Basin and Gulf of Anadyr. Progress in Oceanography, 198: 102662.
DOI:10.1016/j.pocean.2021.102662 |
Nishioka J, Obata H, Ogawa H, et al. 2020. Sub-polar marginal seas fuel the North Pacific through the intermediate water at the termination of the global ocean circulation. Proceedings of the National Academy of Sciences of the United States of America, 117(23): 12665-12673.
DOI:10.1073/pnas.2000658117 |
Nishioka J, Ono T, Saito H, et al. 2011. Oceanic iron supply mechanisms which support the spring diatom bloom in the Oyashio region, western subarctic Pacific. Journal of Geophysical Research: Oceans, 116(C2): C02021.
|
Nishioka J, Takeda S, Kudo I, et al. 2003. Size-fractionated iron distributions and iron-limitation processes in the subarctic NW Pacific. Geophysical Research Letters, 30(14): 1730.
DOI:10.1029/2002GL016853 |
Obayashi Y, Tanoue E, Suzuki K, et al. 2001. Spatial and temporal variabilities of phytoplankton community structure in the northern North Pacific as determined by phytoplankton pigments. Deep Sea Research Part Ⅰ: Oceanographic Research Papers, 48(2): 439-469.
DOI:10.1016/S0967-0637(00)00036-4 |
Park M G, Kim S, Kim H S, et al. 2006. First successful culture of the marine dinoflagellate Dinophysis acuminata. Aquatic Microbial Ecology, 45(2): 101-106.
DOI:10.3354/ame045101 |
Pujari L, Narale D, Kan J J, et al. 2021. Distribution of chromophytic phytoplankton in the eddy-induced upwelling region of the west Pacific Ocean revealed using rbcL genes. Frontiers in Microbiology, 12: 596015.
DOI:10.3389/fmicb.2021.596015 |
Pujari L, Wu C, Kan J J, et al. 2019. Diversity and spatial distribution of chromophytic phytoplankton in the Bay of Bengal revealed by RuBisCO genes (rbcL). Frontiers in Microbiology, 10: 1501.
DOI:10.3389/fmicb.2019.01501 |
Rii Y M, Bidigare R R, Church M J. 2018. Differential responses of eukaryotic phytoplankton to nitrogenous nutrients in the North Pacific Subtropical Gyre. Frontiers in Marine Science, 5: 92.
DOI:10.3389/fmars.2018.00092 |
Roden G I. 1991. Subarctic-subtropical transition zone of the North Pacific: large-scale aspects and mesoscale structure. NOAA Technical Report NMFS, 105(1): 1-38.
DOI:10.5194/bg-5-353-2008 |
Rognes T, Flouri T, Nichols B, et al. 2016. VSEARCH: a versatile open source tool for metagenomics. PeerJ, 4: e2584.
DOI:10.7717/peerj.2584 |
Samanta B, Bhadury P. 2014. Analysis of diversity of chromophytic phytoplankton in a mangrove ecosystem using rbcL gene sequencing. Journal of Phycology, 50(2): 328-340.
DOI:10.1111/jpy.12163 |
Samanta B, Bhadury P. 2016. A comprehensive framework for functional diversity patterns of marine chromophytic phytoplankton using rbcL phylogeny. Scientific Reports, 6(1): 20783.
DOI:10.1038/srep20783 |
Sarthou G, Timmermans K R, Blain S, et al. 2005. Growth physiology and fate of diatoms in the ocean: a review. Journal of Sea Research, 53(1-2): 25-42.
DOI:10.1016/j.seares.2004.01.007 |
Strickland J D H, Parsons T R. 1972. A Practical Handbook of Seawater Analysis. Fisheries Research Board of Canada, Ottawa. 310p.
|
Suzuki K, Minami C, Liu H B, et al. 2002. Temporal and spatial patterns of chemotaxonomic algal pigments in the subarctic Pacific and the Bering Sea during the early summer of 1999. Deep Sea Research Part Ⅱ: Topical Studies in Oceanography, 49(24-25): 5685-5704.
DOI:10.1016/S0967-0645(02)00218-7 |
Taylor F J R, Waters R E. 1982. Spring phytoplankton in the subarctic North Pacific Ocean. Marine Biology, 67(3): 323-335.
DOI:10.1007/BF00397673 |
Tsurushima N, Nojiri Y, Imai K, et al. 2002. Seasonal variations of carbon dioxide system and nutrients in the surface mixed layer at station KNOT (44°N, 155°E) in the subarctic western North Pacific. Deep Sea Research Part Ⅱ: Topical Studies in Oceanography, 49(24-25): 5377-5394.
DOI:10.1016/S0967-0645(02)00197-2 |
Uitz J, Claustre H, Gentili B, et al. 2010. Phytoplankton class-specific primary production in the world's oceans: seasonal and Interannual variability from satellite observations. Global Biogeochemical Cycles, 24(3): GB3016.
DOI:10.1029/2009gb003680 |
Utermöhl H. 1958. Methods of collecting plankton for various purposes are discussed. SIL Communications, 1953-1996, 9(1): 1-38.
DOI:10.1080/05384680.1958.11904091 |
Waga H, Fujiwara A, Hirawake T, et al. 2022. Primary productivity and phytoplankton community structure in surface waters of the western subarctic Pacific and the Bering Sea during summer with reference to bloom stages. Progress in Oceanography, 201: 102738.
DOI:10.1016/j.pocean.2021.102738 |
Xu H H, Tabita F R. 1996. Ribulose-1, 5-bisphosphate carboxylase/oxygenase gene expression and diversity of Lake Erie planktonic microorganisms. Applied and Environmental Microbiology, 62(6): 1913-1921.
DOI:10.1128/aem.62.6.1913-1921.1996 |