 2023, Vol. 41
Institute of Oceanology, Chinese Academy of Sciences
Article Information
- XIN Quandong, CHEN Jufa, MU Changkao, WANG Xinliang, LIU Wenjing, JIANG Tao, LI Yan
- Community composition, co-occurrence, and environmental drivers of bacterioplankton community in surface and 50-m water layers in the subarctic North Pacific
- Journal of Oceanology and Limnology, 41(6): 2309-2323
- http://dx.doi.org/10.1007/s00343-023-2367-3
Article History
- Received Nov. 10, 2022
- accepted in principle Dec. 5, 2022
- accepted for publication Dec. 20, 2022


2 Key Laboratory of Sustainable Development of Marine Fisheries, Ministry of Agriculture, Yellow Sea Fisheries Research Institute, Chinese Academy of Fishery Sciences, Qingdao 266071, China;
3 School of Marine Sciences, Ningbo University, Ningbo 315211, China;
4 School of Medicine, Yunnan University, Kunming 650091, China
Microbes are ubiquitous, and they occupy and play important roles in all possible ecological niches of the marine ecosystems; moreover, the functional processes are commonly determined by the diversity and distribution of bacteria groups (Gilbert et al., 2009; Richa et al., 2017). About 104–107 bacterial cells per milliliter seawater were recorded, and hundreds of species comprise a community in natural marine environments (Torsvik et al., 2002). Bacterioplankton are single cell members belonging to the domains of Bacteria and Archaea that constitute most of taxonomic microorganisms in the ocean. They are keystones of the structure and function of marine ecosystems and drive the global carbon flux and marine food web (Kirchman et al., 2010; Richa et al., 2017; Bowman and Ducklow, 2019). Bacterioplankton typically include phototrophic cyanobacteria and chemotrophic primary producers, as well as secondary heterotrophic producers (Fuhrman et al., 2015). Cyanobacteria are prokaryote algae. A well-known one in the marine system is Synechococcus that widely spread in various marine waters and contributes approximately 25% to global primary productivity (Kolodny et al., 2021). The density of Synechococcus in the surface water of the subarctic North Pacific region reached 105 cells/mL in June (Liu et al., 2002). The heterotrophic bacteria are important for recycling dissolved organic carbon and nutrients in marine water systems and the interactions between autotrophic and heterotrophic bacteria form fundamental links within global nutrient cycles (Buchan et al., 2014).
The distribution pattern of bacterial diversity and their relationship with environmental parameters are important for uncovering their ecological functions. Nutrients, such as nitrate, ammonium, phosphate, and silicate, primary production (Chl-a concentration), and hydrographic features, generally control bacterial community diversity in marine ecosystems (Hernando-Morales et al., 2017; Chun et al., 2021). In addition, bacterial communities vary significantly from the surface to the deeper water layers due to the physical and chemical gradients (Lønborg et al., 2016; Guerrero-Feijóo et al., 2017; Liang et al., 2017).
The Western Subarctic Gyre (WSG) is one of the two gyre-systems (the other one is the Alaskan Gyre, AG) in the subarctic North Pacific that extends from the northeast of Japan to near the international dateline. The WSG is a region of high nutrient and low-chlorophyll waters (Harrison et al., 2004; Fujiki et al., 2014). The low Chl-a concentration in the water of this area is due to Fe-deficiency and light limitation, especially in winter (Nishioka et al., 2003; Harrison et al., 2004; Matsumoto et al., 2014). The dynamics of phytoplankton in the area shows a complex relationship with water physiochemical and biological parameters and with depth-dependent behavior (Fujiki et al., 2011, 2014; Lønborg et al., 2016; Liang et al., 2017; Zhang et al., 2022). However, the taxonomic composition of bacterioplankton community in the WSG region remains relatively unexplored.
To reveal the distribution patterns, co-occurrence, and environmental drivers of bacterioplankton communities in the WSG region, we determined environmental factors in both surface and 50-m layer waters, analyzed the composition of bacterioplankton community in different layers, and explored the correlations among different bacterial OTUs using marine chemistry and molecular ecology techniques.
2 MATERIAL AND METHOD 2.1 Sampling and physicochemical analysesSurface (SW, 1 m) and 50-m layer (FW, 50 m) waters were collected in 22 sites (Fig. 1, stations M1–M22 are listed in latitude order) from May 23, 2021 to July 17, 2021 by the saury fishing vessel "Minghualun" in the WSG of the Northwest Pacific Ocean (40°25′12″N–48°4′48″N, 163°25′12″E– 171°26′24′E). At each site, triplicate samples were prepared. The free-living bacterioplankton cells were collected through 0.22-µm polycarbonate membranes (0.22 μm, Whatman, Britain) for molecular analysis. Water temperature and salinity were measured in-situ by using SBE-37 MicroCAT recorder (Sea-Bird Electronics, USA). The 300 mL water was filtered for subsequent nutrients analysis, and the filtered GF/F membranes (0.7 μm, Whatman, Britain) were reserved; they were quickly stored in liquid nitrogen for Chl-a determination. Then, all samples were stored at -80 ℃. The nutrients, including nitrate (NO3–), nitrite (NO2–), ammonium (NH4+), dissolved reactive phosphorous (DIP), and dissolved silicate (DSi), were determined by QuAAtro continuous flow analyzer (SEAL, Germany), as described by Strickland and Parsons (Strickland and Parsons, 1972). Concentrations of DIN were the sum of NO3-, NO2-, and NH4+. Chl-a concentration was determined by the HPLC method (Agilent 1100, USA) as described by Jiang et al. (2016). Twenty-one phytoplankton pigments were measured, and only Chl-a concentration was used in this study.

|
| Fig.1 Locations of the sampling stations (blue circle) in the Western Subarctic Gyre (WSG) of Northwest Pacific Ocean |
Samples of picophytoplankton and heterotrophic bacteria were prefiltered through a 20-µm mesh netting. Triplicate samples collected from each sampling site were fixed using 2% formaldehyde (final concentration) for 15 min in the 2-mL cryotubes, then they were quickly frozen using liquid nitrogen. Analysis was conducted by a FACSCalibur Flow Cytometer (BD Biosciences, USA) deployed with an air-cooled argon laser (488 nm, 15 mW) (Jiang et al., 2016). For the abundance of heterotrophic bacteria determination, five optical parameters were recorded as follows: two light scatter signals for forward and right angle light scatters; and three fluorescence properties corresponding to emissions in FL1 (530/30 BP), FL2 (585/42 BP), and FL3 (661/16 BP) wavelength ranges. Similar to the heterotrophic prokaryote, the determination of the abundance of picophytoplankton (Synechococcus and pico-eukaryotes) was performed in the same period as the heterotrophic prokaryotes and was based on their light scatter and fluorescence emission properties.
2.3 Total DNA extraction, PCR amplification, and high-throughput sequencingTotal DNAs collected from 0.22-µm pore size polycarbonate membranes (Whatman, Britain) were extracted by using a DNeasy Power Water Kit (QIAGEN, USA) according to the manufacturer's protocols and the qualified DNA samples were stored at -80 ℃ for subsequent analysis. The hypervariable V3–V4 regions of the bacterial 16S rRNA gene was amplified using barcode pair primers (338F: 5′-ACTCCTACGGGAGGCAGCAG-3′ and 806R: 5′-GGACTACHVGGGTWTCTAAT-3′) (Wang et al., 2022). The PCR mixture contains 5×Trans Start Fast Pfu buffer 4 μL, 2.5-mmol/L dNTPs 2 μL, forward primer (5 μm) 0.8 μL, reverse primer (5 μmol/L) 0.8 μL, Trans Start Fast Pfu DNA Polymerase 0.4 μL, template DNA 10 ng, and ddH2O up to 20 μL. PCR reactions were performed in triplicate. The amplification was performed as follows: firstly, the initial denaturation at 95 ℃ for 3 min, then 35 cycles of 95 ℃ for 30 s, 55 ℃ for 30 s, 72 ℃ for 45 s, and finally the extension at 72 ℃ for 10 min. The PCR products were extracted from 2% agarose gel and purified using the Axy Prep DNA Gel Extraction Kit respectively (Axygen Biosciences, Union City, CA, USA) and the concentration was evaluated using QuantusTM Fluorometer (Promega, USA). The purified amplicons were pooled in equimolar and then the paired-end sequencing were performed on an Illumina NovaSeq PE250 platform (Illumina, San Diego, USA) using the standard protocols of Majorbio Bio-Pharm Technology Co., Ltd. (Shanghai, China). All the raw reads obtained in this study were submitted to the NCBI Sequence Read Archive (SRA) database (Accession Number: PRJNA869889).
2.4 Data analysis and OTU clusteringThe raw reads were demultiplexed, quality-filtered by Fastq Version 0.20.0 (Chen et al., 2018), and merged by FLASH version 1.2.7 (Magoč and Salzberg, 2011). The reads for each sample were equalized by random subsample sequences according to the least reads numbers of the sample. The operational taxonomic units (OTUs) were classified using the 97% similarity cutoff threshold (Stackebrandt and Goebel, 1994; Edgar, 2013), and the chimeric sequences were identified and filtered by using UPARSE v7.1 (Edgar, 2013). Then, the taxonomy position for each OTU representative sequence was determined by RDP Classifier v2.2 (Wang et al., 2007) using the 16S rRNA gene database (Silva v. 138) by a confidence threshold of 0.7. The alpha diversity of all the samples, including Shannon diversity, Chao Ⅰ, and Richness indices, were calculated by the vegan package in R (v. 4.1.3). The Wilcoxon signed-rank test was used to analyze the differences for the environmental parameters, alpha diversity indices, even the relative abundance of specific taxon across all samples. Redundancy analysis (RDA) with 9999 Monte Carlo permutation tests and Mantel tests were used to explore the relationships between communities and environmental factors using the CANOCO software version 5.0 and vegan package in R, respectively.
2.5 The co-occurrence network analysisTo reduce the spurious correlation of low abundance individuals and the complexity of the Network, the OTUs with a relative abundance less than 0.01% and occurrence in less than 25% of samples were discarded for constructing the meta-community networks. The Spearman correlation relationships between the selected OTUs were analyzed using the "picante" and "reshape2" packages. Only the significant (P < 0.05) and robust (R > 0.6 or R < -0.6) correlations were selected to incorporate into the network (Barberán et al., 2014). Then the networks were visualized, and the modular analysis, network-level topological properties (i.e., the node, edge, average degree, density, diameter, clustering coefficient, and average path length) were evaluated by using Gephi v0.9.2.
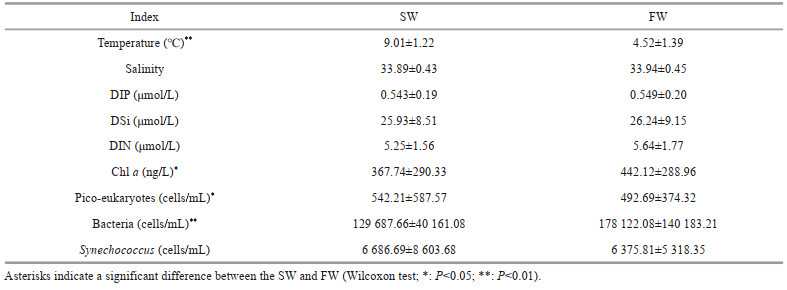
3 RESULT 3.1 Physiochemical charateristics of water samplesThe temperature for SW ranged from 6.96 ℃ to 11.79 ℃ with an average of 9.01 ℃, and those for FW varied from 3.25 ℃ to 7.42 ℃ with an average of 4.52 ℃ (Fig. 2a–b; Table 1). The water temperature of SW and FW showed the same trend, which generally decreased from the south to the north (Fig. 2a). The salinity was comparable between SW and FW ranged from 33.11 to 34.95; temperature showed the same tendency and decreased from southern to northern (Fig. 2c–d). However, the concentrations of nutrients DIN, DIP, and DSi showed contrary tendencies to temperature and salinity (Fig. 3). The lowest concentrations of these nutrients in both layers were observed at M5 station, and the highest concentrations were found at M17 (SW) and M18 (FW) stations (Supplementary Table S1), respectively. Compared with SW, FW seemed to possess higher nutrient levels. Similarly, the Chl-a concentrations were obveriously lower in SW (367.7 ng/L on average) than in FW (average: 442.1 ng/L) (Fig. 2; Supplementary Table S1).

|
| Fig.2 Temperature (a & b), salinity (c & d), and Chl a (e & f) detected in-situ for marine waters of SW (a, c, & e) and FW (b, d, & f) of WSG |

|
| Fig.3 The concentration of DIP (a & b), DIN (c & d), and DSi (e & f) detected in-situ for marine waters of SW (a, c, & e) and FW (b, d, & f) of WSG |
Flow cytometry results showed that pico-plankton consisted of heterotrophic bacteria (HB), Synechococcus, and pico-eukaryotes (PEs), but no Prochlorococcus was observed in this area (Fig. 4).The average abundance of HBs was 1.29×10⁵ cells/mL in SW and 1.78×10⁵ cells/mL in FW (Table 1). However, the average abundance levels of Synechococcus and pico-eukaryotes in SW (542.21± 587.57 cells/mL) were higher than those in FW (492.69±374.32 cells/mL). The Synechococcus showed higher abundance in station M3–M8 in SW and FW. The Synechococcus abundance was lower than that of HBs, with an average abundance of 6.86× 10³ cells/L in SW and 6.37×10³ cells/L in FW.

|
| Fig.4 Abundance of heterotrophic bacteria (HB), Synechococcus (Syn), and pico-eukaryotes (PEs) evaluated by flow cytometry for marine waters of SW (a, c, & e) and FW (b, d, & f) of WSG |
A total of 17 646 004 raw reads, ranging from 78 982 reads to 222 219 reads were generated among the 132 samples collected from 22 stations. After quality control, chimeric filter, and singleton deletion, 15 425 584 high quality reads were left in this study (Table 2). Through randomly sampling according to the least reads number (62 690), a total of 3 269 OTUs were assignied at the 0.03 distance level. Among which, 2 123 OTUs were commonly shared in the both layers, and 494 and 652 were uniquely distributed in SW and FW, respectively (Fig. 5a). Of the 3 269 OTUs, 96.72% (3 172) were assigned to the phylum level (38 phyla), followed by 96.05% (3 140), 92.23% (3 015), 89.75% (2 934), and 82.44% (2 695) to class (93 classes), order (260 orders), family (463 families), and genus (1 074 genera) levels, respectively (Supplementary Table S2). The rarefaction and Shannon curves of all samples reached an asymptote (Supplementary Fig.S1). The Good's coverage values of all sites were greater than 99.59% (Table 2), indicating that the 16S rRNA gene sequences retrieved from these samples could represent most of the bacteria community in this study.

|

|
| Fig.5 Comparison of the OTU distribution (a) and alpha-diversity estimates (b) for the bacterioplankton in SW and FW |
Bacterial Richness and Shannon and Chao I indexes in SW were slightly higher than those in FW without significace (Wilcoxon test, P > 0.05; Fig. 5b). Across all samples in both layers, no distinguishable correlation was found between alpha diversities and environmental factors, but the Shannon index in SW showed significantly positive correlation with the concentration of DIP, DSi, and DIN (Pearson correlation, P < 0.01). However, it showed a negative association with temperature and Chl a (Pearson correlation, P < 0.05) (Supplementary Table S3).
3.4 Bacterial community compositions in different water layersProteobacteria, Cyanobacteria, Bacteroidota, Actinobacteriota, and Firmicutes were dominant phyla (collectively accounting for more than 90% of bacterial reads) in each sample. Proteobacteria was the most abundant in most sampling sites with the exceptions of M1SW, M2SW, M3SW, and M3FW, where Cyanobacteria was the predominant phylum (Fig. 6a–b). At the class level, the dominant groups included Alphaproteobacteria, Gammaproteobacteria, Cyanobacteria, Bacteroidia, Actinobacteria, and Acidimicrobiia (Supplementary Fig.S2). Synechococcus_ CC9902 and/or Psychrobacter were conspicuously abundant genera in all samples, followed by Sulfitobacter, which became dominant groups in M5–M22 stations (Fig. 6c–d). In general, the same enrichment patterns for dominant genera according to the stations were observed at the genus level (Fig. 7; Table S4). The dominant genera mentioned above corresponded exactly to the dominant classes of Cyanobacteria, Gammaproteobacteria, and Alphaproteobacteria. Methylophaga, Oceanibulbus, Colwellia, Alteromonas, norank_f_Moraxellaceae, and unclassified_f_Flavobacteriaceae had similar distribution characteristics, showing a significant decline in the M10–M15 sites of SW (P < 0.01) and FW (Fig. 7).

|
| Fig.6 Relative abundance of the dominant taxa of bacterioplankton at the phylum level (a & b) and genus level (c & d) distributed in SW and FW |

|
| Fig.7 The heatmap generated based on the top 30 abundant bacterial genera in SW and FW |
The Mantel test was used to analyze the influence of environmental parameters on bacterioplankton communities distributed in SW and FW. In SW, except for temperature, other physiochemical characteristics, including salinity, DIP, DSi, and DIN, and Chl a, showed close correlation with bacterioplankton community (P < 0.05) (Fig. 8). However, the bacterioplankton composition in FW was affected by salinity, DIP, DIN, and Chl a (P < 0.05) (Fig. 8). No obvious correlation was found between bacterioplankton community and water temperature in both SW and FW (P≥0.05).

|
| Fig.8 The Mantel analysis to examine the relationship between environmental parameters and the bacterioplankton communities in SW and FW |
The correlations between abundant (top 10 genera) bacterial taxa and environmental characteristics were further investigated. In SW, Synechococcus_ CC9902, Sulfitobacter, PeM15, and Candidatus_ Actinomarina showed obvious positive or negative correlations with DIP, DSi, DIN, and Chl a (P < 0.05). Moreover, PeM15, Oceanibulbus, and Moraxellaceae negatively correlated with salinity. Oceanibulbus negatively related to temperature, whereas Candidatus_ Actinomarina positively correlated with temperature (P < 0.05) (Supplementary Fig.S3). However, in FW, temperature and salinity were the main factors and showed obviously positive or negative correlations with Synechococcus_CC9902, Sulfitobacter, Oceanibulbus, Candidatus_Actinomarina, Cobetia, and PeM15, followed by Chl a, which significantly affected Synechococcus_CC9902, Sulfitobacter, Oceanibulbus, Candidatus_Actinomarina, and PeM15 (P < 0.05). Nutrients DIP, DSi, and DIN negatively correlated with Candidatus_Actinomarina and Cobetia. In addition, DIP showed strongly negative correlation with Synechococcus_CC9902 and positive correlation with PeM15 (P < 0.05). DIN showed obvious correlation with Sulfitobacter (P < 0.05) (Supplementary Fig.S3). These relationships were supported by the correlation analysis performed by Canoco software (Supplementary Fig.S4).
3.6 Co-occurrence networks of microbial communityThe co-occurrence network of bacteria in SW and FW were constructed based on bacterial OTU data. The two networks consisted of 377 and 387 nodes and 9 093 and 7 901 edges (Supplementary Table S5–S6; Supplementary Table S5), indicating that bacteria in SW had more interconnections than those in FW. A set of network-level topological parameters, including the average degree, clustering coefficient, and graph density in SW, were significantly higher than in FW, but the average path length was slightly higher in SW (Supplementary Table S5–S8).
The entire networks were clearly parsed into 5 and 6 modules in SW and FW, respectively. In SW, the network of the five modules (modules Ⅰ, Ⅱ, Ⅲ, Ⅳ, and Ⅴ) accounted for 30.77%, 30.50%, 19.10%, 13.00%, and 6.63% of the whole network respectively. Among them, modules Ⅱ and Ⅲ were dispersed. However, in FW, the 6 modules (modules ⅰ, ⅱ ⅲ, ⅳ, ⅴ, and ⅵ) accounted for 28.68%, 23.26%, 23%, 14.21%, 10%, and 0.78% of the whole network respectively (Fig. 9). The nodes in the co-occurrence network mainly belonged to Proteobacteria (39.79% and 39.02%), Cyanobacteria (7.96% and 7.49%), Bacteroidota (15.65% and 17.05%), Actinobacteriota (12.73% and 12.14%), Firmicutes (8.49% and 8.01%), and other phyla (15.38% and 16.28%) (Supplementary Tables S7–S8). In SW, the majority of OTUs from module Ⅰ and Ⅱ had higher relative abundance levels, whereas most OTUs from module Ⅲ had lower abundance levels. However, in FW, the majority of OTUs classified in modules ⅲ and ⅳ and all the OTUs of module ⅵ had lower relative abundance levels (Supplementary Fig.S5). A total of 11 and 28 keystone OTUs were determined in SW and FW, respectively (Supplementary Tables S9 & S10). The majority of correlations among OTUs belonged to inter-modules (Supplementary Fig.S6), and more positive correlations (84.23% and 85.31%) among OTUs were observed than negative ones (15.77% and 14.69%) in the networks (Fig. 9; Supplementary Table S6) of SW and FW. Negative correlations were mainly found in modules Ⅰ, Ⅱ, and Ⅳ and modules ⅰ and ⅴ.
4 DISCUSSION 4.1 Physiochemical characteristics of seawater varied between the layersThe WSG is one of the two gyre-systems situated in the subarctic North Pacific with a primary productivity that is limited by natural conditions, such as light and iron concentration (Nishioka et al., 2003; Harrison et al., 2004; Matsumoto et al., 2014). Although the biological factors, such as phytoplankton community, which had been investigated by using HPLC-pigment analysis and microscopy in this area were usually studied (Hattori et al., 2004; Fujiki et al., 2009), the distribution and microbial community structure characteristics were poorly studied. The microbial communities could be shaped by physiochemical characteristics in marine water and even sediment environments (Campbell et al., 2015; Liu et al., 2023). In fact, the marine microorganisms with small volume and high abundance drive many biogeochemical processes and play important roles in regulating environmental changes. Furthermore, many phylotypes occur only in particular environments (Sogin et al., 2006; Allison and Martiny, 2008; Liu et al., 2015). Thus, different microbial communities in the SW and FW may also be shaped due to the different characteristics of the marine water.
In this study, the SW and FW from each sampling sites were collected from this area and the physiochemical characteristics and biological factors, such as pico-eukaryotes and the abundance of bacteria and Synechococcus, were detected. The average temperature was higher in SW and pico-eukaryotes density was slightly higher in SW (extremely significant); other factors, such as salinity, the concentrations of DIP, DSi, DIN, and Chl a, and even the densities of bacteria and Synechococcus, were higher in FW than SW (Table 1; Figs. 2–3). Thus, different physiochemical and biological characteristics were observed between the two water layers.

|
| Fig.9 The co-occurrence network analyses of bacterioplankton by module and phylum level in SW (a & c) and FW (b & d) Circles with * are keystone OTUs identified in the network. The font size of the OTUs marked on the subpictures (c & d) correspond to their richness. |
A total of 15 425 584 high quality reads across the two water layers of 22 stations were obtained in this study after random subsample sequences according to the least read numbers (62 690) of the sample. The OTU classification with 97% similarity cutoff and 3 269 OTUs were obtained in this study. The OTU numbers were obviously lower in marine sediment samples (Zhang et al., 2021; Liu et al., 2023), and results were comparable with those obtained in other studies involving samples collected from west Pacific Ocean water (Duan et al., 2021). The two layers commonly shared 2 123 OTUs (account for 64.94% of the total OTUs), indicating that these groups could survive and function in the both layers. However, more unique OTUs were found in FW, which was consistent with the fact that more nutrients were detected in this layer (Table 1 and Fig. 3). Furthermore, the commonly shared OTUs accounted for 99.84% of the total reads, except OTU1252 (accounted for 0.12%), which was uniquely distributed in FW. All uniquely distributed OTUs for both layers were less than 0.01% for each OTU (Supplementary Table S2), which belonged to rare OTUs (Zhang et al., 2021). In accordance with the above, no obvious differences were detected for the alpha indexes, including the observed richness, Chao1, and Shannon, between the two layers (Fig. 5b).
Proteobacteria was the predominant groups, followed by Cyanobacteria, Bacteroidota, and Actinobacteriota in SW and FW (Fig. 6). The major Proteobacteria groups belong to Alphaproteobacteria and Gammaproteobacteria (Supplementary Fig. S2). These findings were consistent with the fact that these groups were dominant phyla in various marine water environments (Campbell et al., 2015; Moran, 2015; Sripan et al., 2021; Zhang et al., 2022; Ismail and Almutairi, 2022). Thus, bacteria belonging to these groups may be the major contributor to the cycle of organic and even inorganic matter in marine aquatic environment. Synechococcus was the predominant genus in our study (Fig. 6c), which was consistent with the fact that it is a globally distributed phytoplankton and is dominant in diverse marine waters (Campbell et al., 2015; Duan et al., 2021; Sripan et al., 2021; Ismail and Almutairi, 2022; Zhang et al., 2022). Furthermore, the density of Synechococcus is larger in SW than in FW according to the flow cytometry results (Table 1), which were consistent the 16S rRNA amplicon sequencing results (Fig. 6). This kind of cyanobacteria could fix carbon to promote the primary production of ocean, and the extracellular polysaccharides excreted by it can provide a consistent but highly diverse class of molecules that can be used exclusively as the substrates for metabolic processes by heterotrophic bacteria (Amin et al., 2015). The obvious positive correlation between Synechococcus_ CC9902 and Chl a indicated that its biomass contributes to primary production in the marine waters. Synechococcus showed obviously correlation with nutrient (Supplementary Figs.S3 & S4) and showed the same pattern in Bohai Sea (Wang et al., 2022), which may due to the fact that its bloom could absorb the nutrients effectively. Synechococcus was also positively associated with heterotrophic bacteria; promoting bacteria, such as Bacteroidetes, with the carbohydrate-active enzyme can catalyze the degradation of algal polysaccharides to achieve this utilization (Teeling et al., 2016). This finding was consistent with the fact that Bacteroidetes was also the dominant group in this study (Fig. 7a & d). Psychrobacter belonged to Gammaproteobacteria, which was distributed in various marine conditions, especially for cold water environments (Welter et al., 2021). This finding was consistent with the fact that its density was larger in the colder samples FW than SW (Fig. 7d). Furthermore, Psychrobacter was frequently isolated from marine animal skin and gut and was presumed to be associate with animals (Welter et al., 2021), and these findings were also consistent with our sampling process performed by fishermen tracking the fish. Another dominant genus Sulfitobacter is a member of the class Alphaproteobacteria. Many strains of this genus were sulfur-oxidizing chemolithoheterotrophic bacteria strains that are widely spread in various marine sources; some members of this genus exhibit algicidal effects against microalga (Barak-Gavish et al., 2018). These groups could degrade diatom-derived dimethylsulfoniopropionate (DMSP) for use as a sulfur source (Amin et al., 2015). Seasonal diatom blooms were observed from late spring to early summer in the WSG and could contribute more than 90% of the chlorophyll in WSG water (Obayashi et al., 2001; Imai et al., 2002). Thus, the domination of Sulfitobacter may be in accordance with the high density in the marine water.
The bacterial sequences belonged to the other dominant genera (> 1%), such as Oceanibulbus, Cobetia, Colwellia, Fomosa, Planktomarina, Pseudoalteromonas, and Alteromonas (Fig. 6). These findings were consistent with the fact that they were also dominant or widely distributed in temperate and polar marine water environments (Qin et al., 2011; Chafee et al., 2018; Reza et al., 2018; Cao et al., 2020; Moriya et al., 2020). Such distribution was in accordance with their functions. Cobetia could degrade alginate (Moriya et al., 2020). Colwellia and Fomosa spp. were psychrophiles could associate with algae (Ivanova et al., 2004; Deming, 2009; Kwon et al., 2014).
Although similar alpha index patterns were present in the both two water layers (Fig. 6), the bacterial community structures in SW and FW were affected by different environmental variables (Fig. 9). Among the top 10 genera distributed in each layer, 7 genera were commonly shared, but the main factors affecting their abundance were different (Supplementary Fig.S4). This finding indicated that they may perform different functions in the two layers. No significant differences were observed between the bacterial community structures in SW and FW, which was consistent with the similar bacterial community variance in 5-, 25-, and 50-m water layers (Wang et al., 2020).
4.3 The community structure is more complex in SWThe topology of the co-occurrence network showed that more connections occurred between the abundant OTUs and other OTUs. The dominant ones were located within the central area of the modules (Fig. 9), emphasizing the vital roles of the abundant OTUs in the community (Zhang et al., 2021). The edges and diameter of SW were larger than FW in co-occurrence network, thereby indicating that the members in FW had closer correlations than those in SW (Table 3). The keystone OTUs were usually distributed in the border of the modules (Fig. 9), which was consistent with the fact that more correlations occurred among OTUs belonging to different modules (Supplementary Fig.S6). More keystone OTUs were found in FW (Fig. 9; Supplementary Tables S9–S10), further indicating that the members of bacterial community in FW had closer correlations. These findings were consistent with the lower edges and less diameter of the network in FW (Table 3). However, the higher clustering coefficient and graph density among the OTUs in SW indicated that the community structure in it was more complex.
5 CONCLUSIONThe physiochemical and biotic characteristics of waters collected from the surface layer (SW) and the fifty-layer (FW) of Western Subarctic Gyre were characterized. Temperature, the average abundance of Synechococcus, and pico-eukaryotes were higher in SW, but the concentrations of DIN, DIP, DSi, and Chl a, as well as the average abundance of heterobacteria, were higher in FW. Among the 3 269 OTUs assigned in this study, 2 123 OTUs were commonly shared in SW and FW. The commonly shared OTUs accounted for 64.94% of the total OTUs and 99.84% of the total reads, which were consistent with the similar alpha diversity pattern we observed in both SW and FW. Proteobacteria, Cyanobacteria, Bacteroidota, Actinobacteriota, and Firmicutes were the main phyla (accounting for more than 90% reads). However, Synechococcus_ CC9902, Psychrobacter, and Sulfitobacter were the dominant genera in each sampling site. Most correlations that happened between the OTUs in the co-occurrence network were positive and inter-module. However, less edges, higher clustering coefficient and graph density among the OTUs in the network were stick to the bacterioplankton community was more complicated in SW than FW. Our results expanded current knowledge on the bacterioplankton community structure and the species correlation characteristics in Western Subarctic Gyre.
6 DATA AVAILABILITY STATEMENTRaw reads of 16S rRNA gene amplicons sequencing is available for download from the Short Reads Archive with NCBI BioProject accession No. PRJNA869889.
Electronic supplementary material
Supplementary material (Supplementary Tables S1–S10 and Figs.S1–S6) is available in the online version of this article at https://doi.org/10.1007/s00343-023-2367-3.
Allison S D, Martiny J B H. 2008. Resistance, resilience, and redundancy in microbial communities. Proceedings of the National Academy of Sciences of the United States of America, 105(S1): 11512-11519.
DOI:10.1073/pnas.0801925105 |
Amin S A, Hmelo L R, Van Tol H M, et al. 2015. Interaction and signalling between a cosmopolitan phytoplankton and associated bacteria. Nature, 522(7554): 98-101.
DOI:10.1038/nature14488 |
Barak-Gavish N, Frada M, Ku C A, et al. 2018. Bacterial virulence against an oceanic bloom-forming phytoplankter is mediated by algal DMSP. Science Advances, 4(10): eaau5716.
DOI:10.1126/sciadv.aau5716 |
Barberán A, Bates S T, Casamayor E O, et al. 2014. Using network analysis to explore co-occurrence patterns in soil microbial communities. ISME Journal, 6(4): 343-351.
DOI:10.1038/ismej.2013.236 |
Bowman J S, Ducklow H W. 2019. Bacterioplankton. In: Cochran J K, Bokuniewicz H J, Yager P L eds. Encyclopedia of Ocean Sciences. 3rd edn Academic Press, Oxford. p. 500-507, https://doi.org/10.1016/B978-0-12-409548-9.11404-6.
|
Buchan A, LeCleir G R, Gulvik C A, et al. 2014. Master recyclers: features and functions of bacteria associated with phytoplankton blooms. Nature Reviews Microbiology, 12(10): 686-698.
DOI:10.1038/nrmicro3326 |
Campbell A M, Fleisher J, Sinigalliano C, et al. 2015. Dynamics of marine bacterial community diversity of the coastal waters of the reefs, inlets, and wastewater outfalls of Southeast Florida. Microbiology Open, 4(3): 390-408.
DOI:10.1002/mbo3.245 |
Cao S N, Zhang F, He J F, et al. 2020. Water masses influence bacterioplankton community structure in summer Kongsfjorden. Extremophiles, 24(1): 107-120.
DOI:10.1007/s00792-019-01139-y |
Chafee M, Fernàndez-Guerra A, Buttigieg P L, et al. 2018. Recurrent patterns of microdiversity in a temperate coastal marine environment. The ISME Journal, 12(1): 237-252.
DOI:10.1038/ismej.2017.165 |
Chen S F, Zhou Y Q, Chen Y R, et al. 2018. Fastp: an ultra-fast all-in-one FASTQ preprocessor. Bioinformatics, 34(17): i884-i890.
DOI:10.1093/bioinformatics/bty560 |
Chun S J, Cui Y S, Baek S H, et al. 2021. Seasonal succession of microbes in different size-fractions and their modular structures determined by both macro- and micro-environmental filtering in dynamic coastal waters. Science of the Total Environment, 784: 147046.
DOI:10.1016/j.scitotenv.2021.147046 |
Deming J W. 2009. Extremophiles: cold environments. In: Schaechter M ed. Encyclopedia of Microbiology. 3rd edn. Academic Press, Oxford. p. 147-158.
|
Duan X P, Guo C, Zhang C, et al. 2021. Effect of East Asian atmospheric particulate matter deposition on bacterial activity and community structure in the oligotrophic Northwest Pacific. Environmental Pollution, 283: 117088.
DOI:10.1016/j.envpol.2021.117088 |
Edgar R C. 2013. UPARSE: highly accurate OTU sequences from microbial amplicon reads. Nature Methods, 10(10): 996-998.
DOI:10.1038/nmeth.2604 |
Fuhrman J A, Cram J A, Needham D M. 2015. Marine microbial community dynamics and their ecological interpretation. Nature Reviews Microbiology, 13(3): 133-146.
DOI:10.1038/nrmicro3417 |
Fujiki T, Matsumoto K, Honda M C, et al. 2009. Phytoplankton composition in the subarctic North Pacific during autumn 2005. Journal of Plankton Research, 31(2): 179-191.
DOI:10.1093/plankt/fbn108 |
Fujiki T, Matsumoto K, Mino Y, et al. 2014. Seasonal cycle of phytoplankton community structure and photophysiological state in the western subarctic gyre of the North Pacific. Limnology and Oceanography, 59(3): 887-900.
DOI:10.4319/lo.2014.59.3.0887 |
Fujiki T, Matsumoto K, Watanabe S, et al. 2011. Phytoplankton productivity in the western subarctic gyre of the North Pacific in early summer 2006. Journal of Oceanography, 67(3): 295-303.
DOI:10.1007/s10872-011-0028-1 |
Gilbert J A, Field D, Swift P, et al. 2009. The seasonal structure of microbial communities in the western English Channel. Environmental Microbiology, 11(12): 3132-3139.
DOI:10.1111/j.1462-2920.2009.02017.x |
Guerrero-Feijóo E, Nieto-Cid M, Sintes E, et al. 2017. Optical properties of dissolved organic matter relate to different depth-specific patterns of archaeal and bacterial community structure in the North Atlantic Ocean. FEMS Microbiology Ecology, 93(1): fiw224.
DOI:10.1093/femsec/fiw224 |
Harrison P J, Whitney F A, Tsuda A, et al. 2004. Nutrient and plankton dynamics in the NE and NW gyres of the subarctic Pacific Ocean. Journal of Oceanography, 60(1): 93-117.
DOI:10.1023/B:joce.0000038321.57391.2a |
Hattori H, Koike M, Tachikawa K, et al. 2004. Spatial variability of living coccolithophore distribution in the western Subarctic Pacific and western Bering Sea. Journal of Oceanography, 60(2): 505-515.
DOI:10.1023/B:JOCE.0000038063.81738.ab |
Hernando-Morales V, Ameneiro J, Teira E. 2017. Water mass mixing shapes bacterial biogeography in a highly hydrodynamic region of the southern Ocean. Environmental Microbiology, 19(3): 1017-1029.
DOI:10.1111/1462-2920.13538 |
Imai K, Nojiri Y, Tsurushima N, et al. 2002. Time series of seasonal variation of primary productivity at station KNOT (44°N, 155°E) in the sub-arctic western North Pacific. Deep Sea Research Part Ⅱ: Topical Studies in Oceanography, 49(24-25): 5395-5408.
DOI:10.1016/S0967-0645(02)00198-4 |
Ismail N, Almutairi A. 2022. Bacterioplankton community profiling of the surface waters of Kuwait. Frontiers in Marine Science, 9: 838101.
DOI:10.3389/fmars.2022.838101 |
Ivanova E P, Alexeeva Y V, Flavier S, et al. 2004. Formosa algae gen. nov., sp. nov., a novel member of the family Flavobacteriaceae. International Journal of Systematic and Evolutionary Microbiology, 54(3): 705-711.
DOI:10.1099/ijs.0.02763-0 |
Jiang T, Chai C, Wang J F, et al. 2016. Temporal and spatial variations of abundance of phycocyanin- and phycoerythrin-rich Synechococcus in Pearl River Estuary and adjacent coastal area. Journal of Ocean University of China, 15(5): 897-904.
DOI:10.1007/s11802-016-3011-z |
Kirchman D L, Cottrell M T, Lovejoy C. 2010. The structure of bacterial communities in the western Arctic Ocean as revealed by pyrosequencing of 16S rRNA genes. Environmental Microbiology, 12(5): 1132-1143.
DOI:10.1111/j.1462-2920.2010.02154.x |
Kolodny Y, Zer H, Propper M, et al. 2021. Marine cyanobacteria tune energy transfer efficiency in their light-harvesting antennae by modifying pigment coupling. The FEBS Journal, 288(3): 980-994.
DOI:10.1111/febs.15371 |
Kwon T, Baek K, Lee K, et al. 2014. Formosa arctica sp. nov., isolated from Arctic seawater. International Journal of Systematic and Evolutionary Microbiology, 64(1): 78-82.
DOI:10.1099/ijs.0.056465-0 |
Liang Y T, Zhang Y Y, Zhang Y, et al. 2017. Distributions and relationships of virio- and picoplankton in the epi-, meso- and bathypelagic zones of the western Pacific Ocean. FEMS Microbiology Ecology, 93(2): fiw238.
DOI:10.1093/femsec/fiw238 |
Liu H B, Imai K, Suzuki K, et al. 2002. Seasonal variability of picophytoplankton and bacteria in the western subarctic Pacific Ocean at station KNOT. Deep Sea Research Part Ⅱ: Topical Studies in Oceanography, 49(24-25): 5409-5420.
DOI:10.1016/S0967-0645(02)00199-6 |
Liu H L, Lin G M, Gao D, et al. 2023. Geographic scale influences the interactivities between determinism and stochasticity in the assembly of sedimentary microbial communities on the South China Sea shelf. Microbial Ecology, 85(1): 121-136.
DOI:10.1007/s00248-021-01946-x |
Liu J W, Liu X S, Wang M, et al. 2015. Bacterial and archaeal communities in sediments of the North Chinese Marginal Seas. Microbial Ecology, 70(1): 105-117.
DOI:10.1007/s00248-014-0553-8 |
Lønborg C, Cuevas L A, Reinthaler T, et al. 2016. Depth dependent relationships between temperature and ocean heterotrophic prokaryotic production. Frontiers in Marine Science, 3: 131.
DOI:10.3389/fmars.2016.00090 |
Magoč T, Salzberg S L. 2011. FLASH: fast length adjustment of short reads to improve genome assemblies. Bioinformatics, 27(21): 2957-2963.
DOI:10.1093/bioinformatics/btr507 |
Matsumoto K, Honda M C, Sasaoka K, et al. 2014. Seasonal variability of primary production and phytoplankton biomass in the western Pacific subarctic gyre: control by light availability within the mixed layer. Journal of Geophysical Research: Oceans, 119(9): 6523-6534.
DOI:10.1002/2014JC009982 |
Moran M A. 2015. The global ocean microbiome. Science, 350(6266): aac8455.
DOI:10.1126/science.aac8455 |
Moriya H, Takita Y, Matsumoto A, et al. 2020. Cobetia sp. bacteria, which are capable of utilizing alginate or waste Laminaria sp. for poly (3-hydroxybutyrate) synthesis, isolated from a marine environment. Frontiers in Bioengineering and Biotechnology, 8: 974.
DOI:10.3389/fbioe.2020.00974 |
Nishioka J, Takeda S, Kudo I, et al. 2003. Size-fractionated iron distributions and iron-limitation processes in the subarctic NW Pacific. Geophysical Research Letters, 30(14): 1730.
DOI:10.1029/2002GL016853 |
Obayashi Y, Tanoue E, Suzuki K, et al. 2001. Spatial and temporal variabilities of phytoplankton community structure in the northern North Pacific as determined by phytoplankton pigments. Deep Sea Research Part Ⅰ: Oceanographic Research Papers, 48(2): 439-469.
DOI:10.1016/S0967-0637(00)00036-4 |
Qin Q L, Li Y, Zhang Y J, et al. 2011. Comparative genomics reveals a deep-sea sediment-adapted life style of Pseudoalteromonas sp. SM9913. The ISME Journal, 5(2): 274-284.
DOI:10.1038/ismej.2010.103 |
Reza M S, Kobiyama A, Yamada Y, et al. 2018. Basin-scale seasonal changes in marine free-living bacterioplankton community in the Ofunato Bay. Gene, 665: 185-191.
DOI:10.1016/j.gene.2018.04.074 |
Richa K, Balestra C, Piredda R, et al. 2017. Distribution, community composition, and potential metabolic activity of bacterioplankton in an urbanized Mediterranean Sea coastal zone. Applied and Environmental Microbiology, 83(17): e00494-17.
DOI:10.1128/AEM.00494-17 |
Sogin M L, Morrison H G, Huber J A, et al. 2006. Microbial diversity in the deep sea and the underexplored "rare biosphere". Proceedings of the National Academy of Sciences of the United States of America, 103(32): 12115-12120.
DOI:10.1073/pnas.0605127103 |
Sripan D, Wilantho A, Khitmoh K, et al. 2021. Marine Bacteria community in a 150-m depth Tachai Island, the Southeast Andaman Sea of Thailand. Frontiers in Marine Science, 8: 624624.
DOI:10.3389/fmars.2021.624624 |
Stackebrandt E, Goebel B M. 1994. Taxonomic note: a place for DNA-DNA reassociation and 16s RRNA sequence analysis in the present species definition in bacteriology. International Journal of Systematic and Evolutionary Microbiology, 44(4): 846-849.
DOI:10.1099/00207713-44-4-846 |
Strickland J D H, Parsons T R. 1972. A Practical Handbook of Seawater Analysis. Fisheries Research Board of Canada, Ottawa, Canada, https://doi.org/10013/epic.46454.d001.
|
Teeling H, Fuchs B M, Bennke C M, et al. 2016. Recurring patterns in bacterioplankton dynamics during coastal spring algae blooms. eLife, 5: e11888.
DOI:10.7554/eLife.11888 |
Torsvik V, Øvreås L, Thingstad T F. 2002. Prokaryotic diversity-magnitude, dynamics, and controlling factors. Science, 296(5570): 1064-1066.
DOI:10.1126/science.1071698 |
Wang J, Guo X X, Li Y Y, et al. 2022. Understanding the variation of bacteria in response to summertime oxygen depletion in water column of Bohai Sea. Frontiers in Microbiology, 13: 890973.
DOI:10.3389/fmicb.2022.890973 |
Wang M M, Ma Y Y, Feng C H, et al. 2020. Diversity of pelagic and benthic bacterial assemblages in the Western Pacific Ocean. Frontiers in Microbiology, 11: 1730.
DOI:10.3389/fmicb.2020.01730 |
Wang Q, Garrity G M, Tiedje J M, et al. 2007. Naive Bayesian classifier for rapid assignment of rRNA sequences into the new bacterial taxonomy. Applied and Environmental Microbiology, 73(16): 5261-5267.
DOI:10.1128/AEM.00062-07 |
Welter D K, Ruaud A, Henseler Z M, et al. 2021. Free-living, psychrotrophic bacteria of the genus Psychrobacter are descendants of pathobionts. mSystems, 6(2): e00258-21.
DOI:10.1128/mSystems.00258-21 |
Zhang X L, Wang L, Peng S J, et al. 2022. Abundance, diversity and functional potentials of planktonic bacteria and microeukaryotes in the coral-reef system of Xisha Islands, China. Journal of Ocean University of China, 21(3): 748-762.
DOI:10.1007/s11802-022-5107-y |
Zhang Y H, Yao P, Sun C, et al. 2021. Vertical diversity and association pattern of total, abundant and rare microbial communities in deep-sea sediments. Molecular Ecology, 30(12): 2800-2816.
DOI:10.1111/mec.15937 |