 2023, Vol. 41
Institute of Oceanology, Chinese Academy of Sciences
Article Information
- NAN Fangru, LI Juan, FENG Jia, LÜ Junping, LIU Qi, LIU Xudong, XIE Shulian
- Comparison and phylogeny on mitochondrial genome of marine and freshwater taxa of genus Hildenbrandia (Florideophyceae, Rhodophyta)
- Journal of Oceanology and Limnology, 41(6): 2324-2335
- http://dx.doi.org/10.1007/s00343-022-2152-8
Article History
- Received Mar. 30, 2022
- accepted in principle Jun. 27, 2022
- accepted for publication Sep. 15, 2022


Red algal genus Hildenbrandia Nardo belongs to subclass Hildenbrandiophycidae, an early derived lineage in Florideophyceae that inhabits in both marine and freshwater environments (Yang et al., 2016). The morphology of Hildenbrandia is characterized by simple crustose thallus construction with a single basal layer and multiple derived vertical rows of cells. The marine and freshwater species resemble each other in vegetative morphology but differ in mode of reproduction (Sherwood et al., 2002). Freshwater species reproduce by gemmae or fragmentation, whereas marine species reproduce by tetrasporangia or fragmentation. Thallus construction of this genus was simple and the reproductive structures that are often used in red algal classification, differ between marine and freshwater species. Therefore, traditional systematics of this genus was controversial. More molecular and morphological studies on Asian freshwater Hildenbrandia specimens are needed to clarify the taxonomy and more studies are needed to clarify existence of already described species based on morphological character only (Vieira et al., 2021a, b). It was reported that freshwater Hildenbrandia species in Europe are monophyletic whereas those in North America are paraphyletic among the marine species (Sherwood and Sheath, 1999, 2000, 2003; Sherwood et al., 2002; Vieira et al., 2021a). Consequently, there exists taxonomy in dispute among samples from different continents based on molecular analysis because phylogenies based on few markers are not well resolved.
With the increasing development of next-generation sequencing technologies, red algal organelle genome information is more accessible (Yang et al., 2015; Lee et al., 2018; Oliveira et al., 2018; Paiano et al., 2018; Cho et al., 2020). Up to now, 109 mitochondrial genomes were accessible in the NCBI website (https://blast.ncbi.nlm.nih.gov/). The number is still inadequate considering the total number of red algae and there are still some taxonomic groups unrepresented. The mitochondrial genomes proved highly conserved among multicellular red algae of the Florideophyceae (Yang et al., 2015). In contrast, extensive mitochondrial gene rearrangements were reported between Bangiophyceae and Florideophyceae and up to 29 lineage-specific genes were found to be absent in some classes and present in others (Yang et al., 2015). Therefore, more mitochondrial genomes are needed to further evaluate the evolution of mitochondrial genome structure in unexplored groups.
Hildenbrandiophycidae is the earliest diverging subclass in class Florideophyceae. The overall gene synteny is conserved among subclasses in Florideophyceae, except for the Hildenbrandiophycidae, suggesting the distinctiveness of this subclass (Yang et al., 2015). Despite its evolutionary significance, the genome information of this lineage is rare with only two chloroplast genomes and one mitochondrial genome reported (Yang et al., 2015; Lee et al., 2016). The unique mitochondrial genome information was from marine H. rubra while the information of freshwater representatives of genus Hildenbrandia is absent (Yang et al., 2015).Mitochondrial genome based phylogeny could provide novel insights into the relationships among diverse taxonomic units and was useful for comparisons at species or population in Rhodophyta (Iha et al., 2018). Mitochondrial genome data from major representatives could be a promising tool to further resolve the relationships of the red algae.
The current study presents mitochondrial genome from Hildenbrandia jigongshanensis F. Nan & S. Xie, a freshwater species firstly reported from China and widely distributed in China and Japan (Nan et al., 2017a, 2019; Vieira et al., 2021b). The features of mitochondrial genome of H. jigongshanensis were compared with that of marine H. rubra and phylogenetic tree based on mitochondrial genomes was reconstructed. Additionally, the mitochondrial genome sequenced in this study provides more evidences for the red algal phylogenetic research.
2 MATERIAL AND METHOD 2.1 Specimen collection and preparationAlgal specimens of H. jigongshanensis were collected from Niangziguan Lake, Shanxi Province, China (37°58′24.6″N, 113°53′27.9″E) on July 7, 2016. The specimens were transferred to laboratory as soon as possible and stored at -80 ℃ after quick freezing using liquid nitrogen.
2.2 Genome sequencing, assembly and annotationTotal DNA was extracted from preserved thalli following the protocol described by Saunders (1993) with modifications following Vis and Sheath (1997). Two paired-end sequencing libraries were constructed using the Illumina Hiseq 2 500 with insertion fragments of 350 bp. After quality control of the Illumina-generated reads, clean data were de-novo assembled using SPAdes 3.8.2 (Bankevich et al., 2012). The assembled contigs were blast with other Rhodophyta mitochondrial genomes and the matched contigs were screened out and extended by a baiting and iteration method using the Price software (Ruby et al., 2013). Extended contigs were loaded as reference sequences using Bowtie 2.1.0 and the mapped reads were assembled again using SPAdes 3.8.2 (Langmead and Salzberg, 2012). The final mitochondrial genome was obtained as a complete circular structure.
The putative Open-Reading Frames (ORFs) were predicted by Unipro UGENE v.38, and protein-coding genes were annotated using blastp (Okonechnikov et al., 2012). Potential protein encoding segments were searched in the newly sequenced DNA and predicted proteins were verified using Smart Blast of the ORF finder. The ribosomal RNA genes were identified by comparing the known genomes of related species on the NCBI website (https://last.ncbi.nlm.nih.gov/). Transfer RNAs were identified using the tRNAscan-SE Search Server6 (http://lowelab.ucsc.edu/tRNAscan-SE/). A graphical representation of the annotated genome was drawn with OGDRAW (http://ogdraw.mpimpgolm.mpg.de/cgi-bin/ogdraw.pl). The newly sequenced mitochondrial genome was submitted to GenBank under the accession number OM981155.
2.3 Structure comparison of mitochondrial genomesThe collinear comparison of mitochondrial genomes between marine and freshwater Hildenbrandia was executed. Additionally, the collinear comparisons between genus Hildenbrandia and florideophycean genus Palmaria and bangiophycean genus Pyropia were executed by Mauve ver. 2.3.1 using default settings (Darling et al., 2004).
2.4 Phylogenomic analysisRed algal mitochondrial genomes of 25 species were downloaded from NCBI according to the blasting results (https://www.ncbi.nlm.nih.gov/genbank/) (Supplementary Table S1). Mitochondrial genome of H. jigongshanensis was aligned with other 25 Rhodophyta mitochondrial genomes using Mauve ver. 2.3.1 under the progressive mode (Darling et al., 2004). The resulting file was used to extract syntenic alignments by HomBlocks (Bi et al., 2018). The orthologous sequences at the genome-scale generated by HomBlocks were used to construct phylogenetic trees. Modeltest was used to infer the optimal evolutionary models of the dataset (Posada and Buckley, 2004). The Neighbor-joining method was performed in the MEGA 5.0 with 1 000 bootstrap repetitions (Tamura et al., 2011). Maximum likelihood tree was constructed using RaxML ver. 8 under 1 000 bootstrap replicates (Felsenstein, 1981; Stamatakis, 2014). Bayesian inference was run for 1 100 000 generations with sampling every 100 generations under the temperature of 0.2. After discarding the first 25% of trees as burn-in, posterior probabilities were calculated using MrBayes 3.2 (Rannala and Yang, 1996; Ronquist et al., 2012). Mitochondrial genome length, GC content and other features (length of CDS, rRNA, tRNA, intron, non-coding region) of each taxa in the phylogenetic tree were calculated and the features were labeled on the tree using online tools EvolView (http://www.evolgenius.info/evolview.html).
2.5 Functional gene loss and substitution rates calculationThe key functional genes were searched in each taxon of the phylogenetic tree. The non-synonymous and synonymous substitution rates (Ka/Ks) for each gene were calculated using the KaKs_calculator (Wang et al., 2010), and the settings were as follows: genetic code table 4; method of calculation: YN. The Ka/Ks values generated for each gene were displayed into the Box-plot using OriginPro 2016 (OriginLab Corporation USA).
3 RESULT 3.1 Feature of mitochondrial genome of Hildenbrandia jigongshanensisThe mitochondrial genome of H. jigongshanensis was 42 459 bp in length and GC content was 30.22%. The encoding regions were 26 112 bp in length. The complete mitochondrial genome encoded 52 genes consisting of 38 protein coding genes (including 16 ORF), 12 tRNAs and 2 rRNAs, among which 22 genes were encoded by the heavy strand (H-strand) and 30 genes were encoded by the light strand (L-strand) (Fig. 1). Seven introns were found in H. jigongshanensis mitochondrial genome. Two introns were found in the genes cox1 and nad5 and one intron was found in genes nad2, nad4, and cox2. The tRNAs found in H. jigongshanensis ranged from 72 to 83 bp and represented 2.13% of the complete sequence. Out of the 12 tRNA genes, 11 tRNA genes were located on the L-strand. Both the large and small subunit ribosomal RNA were located on the H chain, representing 7.17% of the total sequence. The lengths of large and small subunit ribosomal RNAs were 1 719 bp and 1 325 bp respectively and GC contents were 29.61% and 32.30%, respectively.

|
| Fig.1 Mitochondrial genome map of Hildenbrandia jigongshanensis The genes inside and outside of the circles are transcribed in the clockwise and counterclockwise directions, respectively. Genes belonging to different functional groups are shown in different colors. |
The mitochondrial genome of H. jigongshanensis (42 459 bp) was larger than H. rubra (33 066 bp) with longer genes and non-coding regions (Table 1). Collinear alignment structure was observed between the mitochondrial genomes of H. jigongshanensis and H. rubra, except for one block was encoded on the complement strand (Fig. 2a). In H. jigongshanensis, the rearranged block encoded genes including trnM, trnE, trnN, trnU, nad6, rps12, and secY. When compared with the florideophycean genus Palmaria, 4 blocks (14 genes corresponding to cob, cox3, nad1, nad3, trnL, trnG, sdh2, sdh3, trnF, trnQ, trnS, trnG, trnP, and atp9) were rearranged and when compared to the bangiophycean genus Porphyra, 5 blocks (14 genes corresponding to nad1, nad3, trnL, trnG, sdh2, sdh3, trnF, trnQ, trnS, trnG, trnP, atp9, secY, and cox2) were rearranged in H. jigongshanensis (Fig. 2b). Most homologous blocks were rearranged between H. jigongshanensis and bangiophycean genus Porphyra, which was similar with H. rubra. There are 17 genes rearranged between H. rubra and Porphyra umbilicalis whereas 14 genes were rearranged between H. jigongshanensis and Po. umbilicalis. Seven genes were rearranged between H. rubra and Palmaria palmata and 14 genes were rearranged between H. jigongshanensis and Pa. palmata. Fewer genes were rearranged between H. jigongshanesis and Bangiophyceae compared with H. rubra (14 vs. 17), whereas more genes were rearranged between H. jigongshanesis and other Florideophyceae than H. rubra (14 vs. 7).

|
| Fig.2 Synteny alignment of mitochondrial genomes among different lineages of Rhodophyta a. synteny alignment of mitochondrial genomes between H. jigongshanensis and H. rubra; b. synteny alignment of mitochondrial genomes among H. jigongshanensis and closely-related lineage. Each colored bar represents a locally collinear block and is assigned a unique color. White, red, and green boxes represent annotated CDS (protein-coding sequence), rRNAs, and tRNAs in the genomes respectively. Sequences of each colored bar covered are homologous among the aligned genomes. The colored lines connect similar colored blocks and indicate which regions in each genome are homologous. |
Phylogenetic trees based on orthologous sequences extracted from mitochondrial genomes constructed using the Bayesian Inference, the maximum likelihood, and the neighbor-joining methods are consistent in topological structures. Thus, only the maximum likelihood tree is illustrated with supporting values of ML bootstrap, the Bayesian posterior probabilities and neighbor-joining labeling on the nodes of the tree (Fig. 3). With Cyanidiophyceae setting as outgroup, the phylogenetic tree consisted of three main branches including Compsopogonophyceae, Bangiophyceae, and Florideophyceae. With Compsopogonophyceae resolved as the earliest divergent lineage, the classes Bangiophyceae and Florideophyceae were resolved as sister with high support (99.4/1/97). Bangiophyceae and Florideophyceae formed an independent branch supported by full values and 98.1/1/99, respectively. In the Florideophyceae clade, the subclass Hildenbrandiophycidae as the earliest diverged lineage and subclasses including Nemaliophycidae, Rhodymeniophycidae, and Corallinophycidae clustered together (61.2/0.96/99). In Nemaliophycidae subclass, the freshwater order Batrachospermales and Thoreales clustered together with the marine member of Palmariales supported by 99.1/1/93. In Hildenbrandiophycidae subclass, H. jigongshanensis and H. rubra were resolved in a fully supported clade.

|
| Fig.3 Phylogenetic trees based on mitochondrial genomes, with each genomic features labeled on the tree Support values for all analyses are shown as follows: ML bootstrap/Bayesian posterior probabilities/NJ distance. " - " denotes < 50% support for that analyses at that node. |
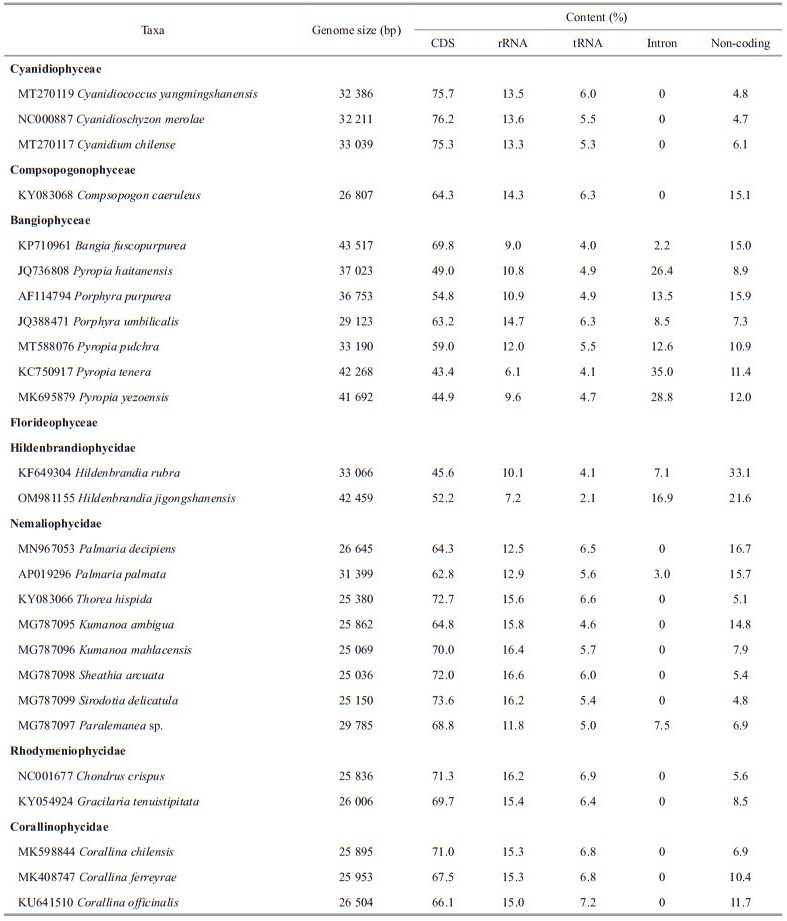
The mitochondrial genomes of Florideophyceae lineage were generally longer than the Bangiophyceae (Fig. 3). In Florideophyceae lineage, the freshwater members including genera Thorea, Sheathia, Sirodotia, and Kumanoa in subclass Nemaliophycidae were slightly smaller than the marine Palmaria in mitochondrial genome size. The subclass Hildenbrandiophycidae owned the largest mitochondrial genomes among class Florideophyceae (Fig. 3).
The percentage of the mitochondrial genome that represents CDSs in Hildenbrandiophycidae (45.6%–52.2%) was lower than that of other subclasses in Florideophycidae (62.8%–73.6%). Similarly, the percentages of rRNA and tRNA in mitochondrial genome of Hildenbrandiophycidae (7.2%–10.1% and 2.1%–4.1% respectively) were lower than those of other subclasses in Florideophycidae (11.8%–16.4% and 4.6%–7.2% respectively). Whereas the percentages of intron sequences in mitochondrial genomes of Hildenbrandiophycidae (7.1%–16.9% and 2.1%–4.1%, respectively) were higher. The introns were absent in most members of other Florideophyceae subclasses except for Palmaria palmata (3.0%) and Paralemanea sp. (7.5%). Percentage of non-coding regions in mitochondrial genome of Hildenbrandiophycidae (21.6%–33.1%) was higher than that of other subclasses in Florideophycidae (4.8%–16.7%). In Hildenbrandiophycidae, percentages of CDS and introns in mitochondrial genome of H. jigongshanensis were higher than those of H. rubra whereas the percentages of tRNA, rRNA and non-coding were lower than those of H. rubra.
GC contents of the classes Cyanidiophyceae and Compsopogonophyceae except Cyanidium chilense were lower (26.40%–27.38%) than in the class Bangiophyceae. Mitochondrial genomic GC content of Bangiophyceae (30.67%–33.49%) was generally higher than the Florideophyceae (26.94%–32.96%) except for H. rubra (32.20%), genus Palmaria (32.19%–32.96%) and Paralemanea sp. (32.42%). In Hildenbrandiophycidae, GC content of H. jigongshanensis was lower (30.22%) than H. rubra (32.20%).
3.4 Encoding genes comparison among close-related lineages in RhodophytaAtp4 (synonymous with ymf39) was absent in some members of Bangiophyceae. Neither atp4 nor ymf39 was found in genus Hildenbrandia. Among other subclasses in Florideophyceae, either atp4 or ymf39 was found. Additionally, atp8 was present in all the members of Bangiophyceae and Florideophyceae except H. rubra. Rpl20 was absent from genus Hildenbrandia and most Bangiophyceae members except Porphyra umbilicalis (JQ388471), and it was lost in some members of Nemaliophycidae such as genus Kumanoa and Paralemanea. Additionally, rrn5 was absent from all members of Bangiophyceae and genus Hildenbrandia, and it was present in genus Kumanoa, Sirodotia, Paralemanea and Sheathia among Nemaliophyceae. SecY' (synonymous with tatC) was present in Bangiophyceae and Florideophyceae except Kumanoa ambigua (MG787095) (Fig. 4).

|
| Fig.4 Protein-coding gene comparisons among closely related species in Bangiophyceae and Florideophyceae T represents that the gene is repeated in the genome due to error in genome annotation, and it is confirmed by homologous sequence alignment that one of the two repeated genes should be the other gene, and is indicated by ↓ and *. ● means that the gene does not exist in the original genome due to error in genome annotation, and was found through homologous sequence alignment. |
The Ka/Ks calculation results showed that the in atp complex, the subunit 4 and 8 were higher in nucleotide substitution rates. The nucleotide substitution rates of cob, cox, and nad complex were rather low. In sdh complex, the ratios were high for subunit 3 and 4, but low for subunit 2. The ratios of rpl complex were very high especially for rpl20. In rps complex, the ratio of subunit 12 was low but those of subunits 3 and 11 were higher. The substitution ratios of secY, ymf39, and tatC were all high and the variance scopes of these three genes were also large. The substitution ratios and variance were the highest in rpl20 and subsequent for secY (Fig. 5).

|
| Fig.5 Ka/Ks ratios of key functional genes in the mitochondrial genome |
The mitochondrial genome of H. jigongshanensis was the largest among the florideophycean taxa reported up to now (42.4 kb vs. 24.9–33.1 kb), and the GC content was within the range (30.20% vs. 23.6%–36.4%) (Yang et al., 2015). Hildenbrandia jigongshanensis inhabited freshwater environments and formed an independent branch with its marine relative H. rubra based on multiple analysis (Nan et al., 2017a, b; Vieira et al., 2021b). By comparison, the genome size of H. jigongshanensis was larger and GC content was lower than H. rubra. The size variance was similar than in the chloroplast genome while GC content was opposite (Nan et al., 2017b). The lengths of protein-coding region and intron sequence conspicuously differed in H. jigongshanensis and H. rubra. This result was contrary when compared with the chloroplast genome, which showed no significant difference in protein-coding regions (Nan et al., 2017b). Two introns (distributed in rrl and cox1 respectively) were found in mitochondrial genome of the marine H. rubra (Yang et al., 2015). By comparison, seven introns were found in H. jigongshanensis (no intron in rrl, two introns in cox1, and introns in other genes). Compared with Bangiophyceae, a reduced intron in cox1 was found in H. rubra, a common feature shared in Florideophyceae. However, there exist two introns in cox1 of H. jigongshanensis, which was similar with Bangiophyceae (Yang et al., 2015). Similar with H. rubra, the trnI gene was absent in freshwater H. jigongshanensis, supporting the conclusion that trnI-intron was lost in genus Hildenbrandia (Yang et al., 2015).
Two large blocks were rearranged between chloroplast genomes of H. rubra and H. rivularis (Nan et al., 2017b). By comparison, only one small block was rearranged in the mitochondrial genomes of H. rubra and H. jigongshanensis, which showed higher conservation of mtDNA gene syntheny and was consistent with previous report (Yang et al., 2015). More similarities in mitochondrial genome organization between H. jigongshanensis and Porphyra umbilicalis (Bangiophyceae) were found than those between H. rubra and Bangiophyceae taxa. Two large conserved regions, those were, nad2-sdh4-nad4-nad5-atp8-atp6 (ANS segment) and ymf39-cox3-cox2-cox1 (CY segment) were found between Bangiophyceae and Florideophyceae in previous report (Yang et al., 2015). In H. rubra, ANS segment was conserved whereas CY segment (cox1-cox2-cox3) was inverted in gene order and lost ymf39 (or atp4) compared with the bangiophycean taxa. Similarly, ANS segment was also observed in H. jigongshanensis, whereas genes in CY segment were rearranged (cox1-cox3-cox2). The gene rearrangement may have occurred several times in the evolution of mitochondrial genome. Comparison of mitochondrial genome organization suggests that H. jigongshanensis preserves characters that could be hypothetically more similar to the ancestor of Bangiophyceae and Florideophyceae. Currently, marine Hildenbrandia species is considered primitive than freshwater members based on phylogenetic tree constructed using chloroplast rbcL and nuclear 18S rDNA gene sequences (Sherwood et al., 2002; Vieira et al., 2021b). However, our study of the mitochondrial genome differs from results based on chloroplast and nuclear markers. It may be caused by limited taxon sampling in our study or different evolutionary processes of mitochondrial genome from those of chloroplast and nuclear genomes. Further studies using additional genomes and species are needed to clarify this discrepancy.
Three cyanidiophycean, one compsopogonophycean, seven bangiophycean, and fifteen florideophycean taxa were included in our phylogenetic analysis, thus resulting in a database of 26 mitochondrial genomes from red algae for the phylogenetic and comparative analyses. The result was consistent with multiple-gene based and chloroplast genome based phylogenies (Yoon et al., 2006; Le Gall and Saunders, 2007; Nan et al., 2017b). Mitochondrion-based phylogeny in this study resulted in better solution at both the deep and recent derived nodes by providing high supports at many nodes than phylogenies based on few markers (Nan et al., 2017a, 2019). H. jigongshanensis grouped with H. rubra and diverged earliest in the Florideophyceae clade, which supports the ancient evolutionary origins of Hildenbrandia in this class (Yang et al., 2016).
Except for the outgroup Cyanidiophyceae, the mitochondrial genome size increased first and then decreased from earlier (Compsogonophyceae) to more recent diverged lineages (Florideophyceae) in red algae, which is consistent with previous reports of both chloroplast and mitochondrial genomes (Nan et al., 2017b). The evolution patterns of mitochondrial genome size diverged among eukaryotic lineages. The evolutionary trend was toward a further compaction of the mitochondrial genome in animals, whereas the mitochondrion genomes tend to increase in size by acquisition of large amount of non-coding DNA in plants (Gray et al., 1998). In the majority of protist, mtDNAs are compact with few or no large non-coding regions (< 10% of the mtDNA) (Gray et al., 1998). Surprisingly, non-coding regions accounted for 21.6%–33.1% of the total mtDNA in genus Hildenbrandia, which is conspicuously higher than other red algae in our phylogenetic tree (4.7%–16.7%). It has been proved protist mtDNAs have evolved in the direction of higher A+T content generally (Gray et al., 1998). Contrary to the general trend, the GC content of genus Hildenbrandia (30.2%–32.2%) was lower than Nemaliophycidae genus Palmaria (32.1%–32.9%). More genomes of Hildenbrandia lineage are needed to confirm the observed patterns.
Most protein-coding genes were identical in H. jigongshanensis and H. rubra except atp8 that was present in H. jigongshanensis while absent from H. rubra. The atp8 gene was found in all the other Bangiophyceae and Florideophyceae members, thus suggesting that it was present in the ancestor of genus Hildenbrandia and lost in H. rubra. Pseudogenization or outright loss of atp8 was observed in the coralline red alga Neogoniolithon spectabile and mitochondrial genomes of parasite species (Hancock et al., 2010; Lee et al., 2018). The atp8 gene encoded the ATP8 subunit of the F1F0-ATP synthase complex and was reported to have been transferred to the nuclear genome in many lineages including apicomplexans, dinoflagellates, and green algae (Denovan-Wright et al., 1998; Slamovits et al., 2007). Whether the atp8 gene was transferred to the nuclear genome or simply lost in H. rubra remains unclear and further studies are needed. The atp4 and rpl20 genes were absent in mitochondrial genomes of both H. jigongshanensis and H. rubra, as ymf39 was synonymous with atp4 (Burger et al., 2003). The loss of atp4 was only found in genus Hildenbrandia and occurred only once. The gene rpl20 was only present in some mitochondrial genomes, and it has been lost in Hildenbrandia, Porphyra purpurea, Bangia fuscopurpurea, the ancestor of six Pyropia species, and Wildemania schizophylla (Yang et al., 2015). The mitochondrial genomes of more Hildenbrandia species are needed to elucidate whether this gene might have been lost in the common ancestor of the lineage.
Higher Ka/Ks ratios of the atp and sdh in Rhodophyta mitochondrial genomes have been reported in a previous study (Nan et al., 2017b). Similarly, high Ka/Ks ratios of atp4, ymf39 (synonymous with atp4), atp8, sdh3, and sdh4 were observed in our study. Along with these genes, the rpl and rps had high Ka/Ks ratios, especially for the rpl20. As aforementioned, loss of rpl20 was the most common in Bangiophyceae and Florideophyceae taxa to date. Additionally, the absence of the ribosomal and succinate dehydrogenease genes (rpl, rps, and sdh) has been found in land plants (Adams et al., 2002; Adams and Palmer, 2003), and genes including rpl, rps, sdh, secY, and atp4 have been lost in red alga Galdieria sulphuraria (Cho et al., 2020). Thus, we infer there was a trend that high Ka/Ks ratio genes were more frequently lost than low Ka/Ks ratio ones in red algae.
5 CONCLUSIONThe mitochondrial genome of freshwater H. jigongshanensis was sequenced and characterized in our study. The size was the largest among the mitochondrial genomes of florideophycean taxa reported up to now, with 42 459 bp in length and GC content of 30.22%. Genome size of H. jigongshanensis was larger and GC content was lower than marine H. rubra. The presence of introns was more common in H. jigongshanensis than in H. rubra. Rearrangement of one small block was observed in the mitochondrial genomes between H. rubra and H. jigongshanensis. Compared with H. rubra, fewer genes were rearranged between H. jigongshanesis and Bangiophyceae whereas more genes were rearranged between H. jigongshanesis and Florideophyceae. Most protein-coding genes between H. jigongshanensis and H. rubra were identical except atp8 was present in H. jigongshanensis while absent from H. rubra.Mitochondrion-based phylogeny in this study resulted in better solution at both the deep and recent derived nodes than single-gene based phylogenies. Higher Ka/Ks ratios genes consisting of atp4, atp8, sdh3, sdh4, rpl, and rps are more frequently lost than low Ka/Ks ratio ones in red algae.
6 DATA AVAILABILITY STATEMENTThe assembled datasets generated during and/ or analyzed during the current study are available from the corresponding author on reasonable request.
Electronic supplementary material
Supplementary material (Supplementary Table S1) is available in the online version of this article at https://doi.org/10.1007/s00343-022-2152-8.
Adams K L, Palmer J D. 2003. Evolution of mitochondrial gene content: gene loss and transfer to the nucleus. Molecular Phylogenetics and Evolution, 29(3): 380-395.
DOI:10.1016/S1055-7903(03)00194-5 |
Adams K L, Qiu Y L, Stoutemyer M, et al. 2002. Punctuated evolution of mitochondrial gene content: high and variable rates of mitochondrial gene loss and transfer to the nucleus during angiosperm evolution. Proceedings of the National Academy of Sciences, 99(15): 9905-9912.
DOI:10.1073/pnas.042694899 |
Bankevich A, Nurk S, Antipov D, et al. 2012. SPAdes: a new genome assembly algorithm and its applications to single-cell sequencing. Journal of Computational Biology, 19(5): 455-477.
DOI:10.1089/cmb.2012.0021 |
Bi G Q, Mao Y X, Xing Q K, et al. 2018. "HomBlocks": a multiple-alignment construction pipeline for organelle phylogenomics based on locally collinear block searching. Genomics, 110(1): 18-22.
DOI:10.1016/j.ygeno.2017.08.001 |
Burger G, Lang B F, Braun H P, et al. 2003. The enigmatic mitochondrial ORF ymf39 codes for ATP synthase chain b. Nucleic Acids Research, 31(9): 2353-2360.
DOI:10.1093/nar/gkg326 |
Cho C H, Park S I, Ciniglia C, et al. 2020. Potential causes and consequences of rapid mitochondrial genome evolution in thermoacidophilic Galdieria (Rhodophyta). BMC Evolutionary Biology, 20(1): 112.
DOI:10.1186/s12862-020-01677-6 |
Darling A C E, Mau B, Blattner F R, et al. 2004. Mauve: multiple alignment of conserved genomic sequence with rearrangements. Genome Research, 14(7): 1394-1403.
DOI:10.1101/gr.2289704 |
Denovan-Wright E M, Nedelcu A M, Lee R W. 1998. Complete sequence of the mitochondrial DNA of Chlamydomonas eugametos. Plant Molecular Biology, 36(2): 285-295.
DOI:10.1023/A:1005995718091 |
Felsenstein J. 1981. Evolutionary trees from DNA sequences: a maximum likelihood approach. Journal of Molecular Evolution, 17(6): 368-376.
DOI:10.1007/BF01734359 |
Gray M W, Lang B F, Cedergren R, et al. 1998. Genome structure and gene content in protist mitochondrial DNAs. Nucleic Acids Research, 26(4): 865-878.
DOI:10.1093/nar/26.4.865 |
Hancock L, Goff L, Lane C. 2010. Red algae lose key mitochondrial genes in response to becoming parasitic. Genome Biology and Evolution, 2: 897-910.
DOI:10.1093/gbe/evq075 |
Iha C, Grassa C J, de M Lyra G, et al. 2018. Organellar genomics: a useful tool to study evolutionary relationships and molecular evolution in Gracilariaceae (Rhodophyta). Journal of Phycology, 54(6): 775-787.
DOI:10.1111/jpy.12765 |
Langmead B, Salzberg S L. 2012. Fast gapped-read alignment with Bowtie 2. Nature Methods, 9(4): 357-359.
DOI:10.1038/nmeth.1923 |
Le Gall L, Saunders G W. 2007. A nuclear phylogeny of the Florideophyceae (Rhodophyta) inferred from combined EF2, small subunit and large subunit ribosomal DNA: establishing the new red algal subclass Corallinophycidae. Molecular Phylogenetics and Evolution, 43(3): 1118-1130.
DOI:10.1016/j.ympev.2006.11.012 |
Lee J M, Cho C H, Park S I, et al. 2016. Parallel evolution of highly conserved plastid genome architecture in red seaweeds and seed plants. BMC Biology, 14(1): 75.
DOI:10.1186/s12915-016-0299-5 |
Lee J M, Song H J, Park S I, et al. 2018. Mitochondrial and plastid genomes from coralline red algae provide insights into the incongruent evolutionary histories of organelles. Genome Biology and Evolution, 10(11): 2961-2972.
DOI:10.1093/gbe/evy222 |
Nan F R, Feng J, Lv J P, et al. 2017a. Hildenbrandia jigongshanensis (Hildenbrandiaceae, Rhodophyta), a new freshwater species described from Jigongshan Mountain, China. Phytotaxa, 292(3): 243-252.
DOI:10.11646/phytotaxa.292.3.4 |
Nan F R, Feng J, Lv J P, et al. 2017b. Origin and evolutionary history of freshwater Rhodophyta: further insights based on phylogenomic evidence. Scientific Reports, 7(1): 2934.
DOI:10.1038/s41598-017-03235-5 |
Nan F R, Han J F, Feng J, et al. 2019. Morphological and molecular investigation of freshwater Hildenbrandia (Hildenbrandiales, Rhodophyta) with a new species reported from Japan. Phytotaxa, 423(2): 68-74.
DOI:10.11646/phytotaxa.423.2.2 |
Okonechnikov K, Golosova O, Fursov M, et al. 2012. Unipro UGENE: a unified bioinformatics toolkit. Bioinformatics, 28(8): 1166-1167.
DOI:10.1093/bioinformatics/bts091 |
Oliveira M C, Repetti S I, Iha C, et al. 2018. High-throughput sequencing for algal systematics. European Journal of Phycology, 53(3): 256-272.
DOI:10.1080/09670262.2018.1441446 |
Paiano M O, Del Cortona A, Costa J F, et al. 2018. Complete mitochondrial genomes of six species of the freshwater red algal order Batrachospermales (Rhodophyta). Mitochondrial DNA Part B, 3(2): 607-610.
|
Posada D, Buckley T R. 2004. Model selection and model averaging in phylogenetics: advantages of akaike information criterion and Bayesian approaches over likelihood ratio tests. Systematic Biology, 53(5): 793-808.
DOI:10.1080/10635150490522304 |
Rannala B, Yang Z H. 1996. Probability distribution of molecular evolutionary trees: a new method of phylogenetic inference. Journal of Molecular Evolution, 43(3): 304-311.
DOI:10.1007/BF02338839 |
Ronquist F, Teslenko M, Van Der Mark P, et al. 2012. MrBayes 3.2: efficient Bayesian phylogenetic inference and model choice across a large model space. Systematic Biology, 61(3): 539-542.
DOI:10.1093/sysbio/sys029 |
Ruby J G, Bellare P, DeRisi J L. 2013. PRICE: software for the targeted assembly of components of (Meta) genomic sequence data. G3: Genes, Genomes, Genetics, 3(5): 865-880.
DOI:10.1534/g3.113.005967 |
Saunders G W. 1993. Gel purification of red algal genomic DNA: an inexpensive and rapid method for the isolation of polymerase chain reaction-friendly DNA. Journal of Phycology, 29(2): 251-254.
DOI:10.1111/j.0022-3646.1993.00251.x |
Sherwood A R, Shea T B, Sheath R G. 2002. European freshwater Hildenbrandia (Hildenbrandiales, Rhodophyta) has not been derived from multiple invasions from marine habitats. Phycologia, 41(1): 87-95.
DOI:10.2216/i0031-8884-41-1-87.1 |
Sherwood A R, Sheath R G. 1999. Biogeography and systematics of Hildenbrandia (Rhodophyta, Hildenbrandiales) in North America: inferences from morphometrics and rbcL and 18S rRNA gene sequence analyses. European Journal of Phycology, 34(5): 523-532.
DOI:10.1080/09541449910001718881 |
Sherwood A R, Sheath R G. 2000. Biogeography and systematics of Hildenbrandia (Rhodophyta, Hildenbrandiales) in Europe: inferences from morphometrics and rbc L and 18S rRNA gene sequence analyses. European Journal of Phycology, 35(2): 143-152.
DOI:10.1080/09670260010001735731 |
Sherwood A R, Sheath R G. 2003. Systematics of the Hildenbrandiales (Rhodophyta): gene sequence and morphometric analyses of global collections. Journal of Phycology, 39(2): 409-422.
DOI:10.1046/j.1529-8817.2003.01050.x |
Slamovits C H, Saldarriaga J F, Larocque A, et al. 2007. The highly reduced and fragmented mitochondrial genome of the early-branching dinoflagellate Oxyrrhis marina shares characteristics with both apicomplexan and dinoflagellate mitochondrial genomes. Journal of Molecular Biology, 372(2): 356-368.
DOI:10.1016/j.jmb.2007.06.085 |
Stamatakis A. 2014. RAxML version 8: a tool for phylogenetic analysis and post-analysis of large phylogenies. Bioinformatics, 30(9): 1312-1313.
DOI:10.1093/bioinformatics/btu033 |
Tamura K, Peterson D, Peterson N, et al. 2011. MEGA5: molecular evolutionary genetics analysis using maximum likelihood, evolutionary distance, and maximum parsimony methods. Molecular Biology and Evolution, 28(10): 2731-2739.
DOI:10.1093/molbev/msr121 |
Vieira C, Akita S, Kim Y S, et al. 2021a. First record of the genus Hildenbrandia (Florideophyceae: Hildenbrandiales) from French Polynesia and description of H. tahitiensis sp. nov.. Journal of Asia-Pacific Biodiversity, 14(4): 607-612.
DOI:10.1016/j.japb.2021.07.008 |
Vieira C, Akita S, Uwai S, et al. 2021b. Hildenbrandia (Hildenbrandiales, Florideophyceae) from Japan and taxonomic lumping of H. jigongshanensis and H. japananensis. Phycological Research, 69(3): 166-170.
DOI:10.1111/pre.12456 |
Vis M L, Sheath R G. 1997. Biogeography of Batrachospermum gelatinosum (Batrachospermales, Rhodophyta) in North America based on molecular and morphological data. Journal of Phycology, 33(3): 520-526.
DOI:10.1111/j.0022-3646.1997.00520.x |
Wang D P, Zhang Y B, Zhang Z, et al. 2010. KaKs_Calculator 2.0: a toolkit incorporating gamma-series methods and sliding window strategies. Genomics, Proteomics & Bioinformatics, 8(1): 77-80.
DOI:10.1016/S1672-0229(10)60008-3 |
Yang E C, Boo S M, Bhattacharya D, et al. 2016. Divergence time estimates and the evolution of major lineages in the florideophyte red algae. Scientific Reports, 6: 21361.
DOI:10.1038/srep21361 |
Yang E C, Kim K M, Kim S Y, et al. 2015. Highly conserved mitochondrial genomes among multicellular red algae of the Florideophyceae. Genome Biology and Evolution, 7(8): 2394-2406.
DOI:10.1093/gbe/evv147 |
Yoon H S, Müller K M, Sheath R G, et al. 2006. Defining the major lineages of red algae (Rhodophyta). Journal of Phycology, 42(2): 482-492.
DOI:10.1111/j.1529-8817.2006.00210.x |