 2023, Vol. 41
Institute of Oceanology, Chinese Academy of Sciences
Article Information
- YANG Mei, SUI Jixing, LI Xinzheng
- The first complete mitogenome of Acharax sp. (Protobranchia, Solemyida, Solemyidae): comparisons with other Solemyidae bivalves and deep-sea adaptive characteristics
- Journal of Oceanology and Limnology, 41(6): 2374-2390
- http://dx.doi.org/10.1007/s00343-022-2217-8
Article History
- Received May 7, 2022
- accepted in principle Jul. 8, 2022
- accepted for publication Oct. 17, 2022


2 Center for Ocean Mega-Science, Chinese Academy of Sciences, Qingdao 266071, China;
3 University of Chinese Academy of Sciences, Beijing 100049, China;
4 Laboratory for Marine Biology and Biotechnology, Qingdao National Laboratory for Marine Science and Technology, Qingdao 266237, China
Solemyidae is an intriguing group of protobranch bivalves whose fossil records trace back to the early Ordovician (Pojeta, 1988) and includes, as modern solemyids, two reciprocally monophyletic genera, Acharax Dall, 1908 and Solemya s. l. Gray 1840. These are distinguished by the position of the ligament: external in Acharax while internal in Solemya s. l. (Taylor et al., 2008; Kamenev, 2009; Oliver et al., 2011; Sharma et al., 2013). Solemyid bivalves are distributed at various depths around the world, generally to inhabit in anaerobic muddy and sandy bottoms and organic falls (Conway et al., 1992; Fujiwara, 2003), and nutritionally depend on intracellular chemosynthetic symbionts (Fisher and Childress, 1986; Rodrigues et al., 2010; Walton, 2015; Fukasawa et al., 2017). Acharax generally has a deeper distribution (400–5 379 m) associated with reducing environments (Neulinger et al., 2006), while Solemya is found mainly in the continental shelf and upper slope (0–600 m) (Neulinger et al., 2006; Oliver et al., 2011), however, with further research, Solemya has also been recorded from bathyal depths (Oliver et al., 2011; Sato et al., 2013).
Because the shell characteristics of solemyids are conservative and difficult to assess (Kamenev, 2009; Oliver et al., 2011), and they lack features such as shell sculpture and hinge teeth and are uniformly covered by distinctive, thick, shiny periostracum (Taylor et al., 2008; Saether et al., 2016), little morphological and molecular work has focused on protobranch bivalves. Therefore, the taxonomy and systematic status of Solemyidae are still problematic (Walton, 2015; Fukasawa et al., 2017). Moreover, solemyids live in deep burrows (Seike et al., 2012) and are able to swim when disturbed, which hinders the collecting work.
Mitochondrial genomes (mitogenomes) have been proven to be a useful source of molecular markers for taxonomic identification, population genetics studies, phylogeography and phylogenetic analysis of bivalves at different taxonomic levels, including members of Protobranchia (Sharma et al., 2013; Sato et al., 2020). The typical metazoan mitogenome is a closed circular molecule of 12–22 kb, usually contains 37 genes: 13 protein-coding genes (PCGs), 2 rRNAs, and 22 tRNAs (Boore, 1999). With the maturity of next-generation sequencing technology, comparative analysis and phylogenetic studies of bivalves based on complete mitogenomes have recently become popular (Uribe et al., 2018; Liu et al., 2020; Rahuman et al., 2020). At present, there are more than 950 species of protobranchia recorded around the world, but only 4 mitogenomes have been sequenced (Plazzi et al., 2013; Russell et al., 2018), all of which belong to Solemyidae (Solemya elarraichensis, S. pervernicosa, S. velesiana, and S. velum), and no mitogenome of the genus Acharax has been sequenced. This means evaluation of the systematic status of Solemyidae using mitogenomes is unachievable.
Our goal is to show that mitogenomes can be used to reconstruct the phylogeny of bivalves and further demonstrate its potential for resolving the systematic position of Solemyida. We attempted to accomplish this by: (ⅰ) characterize the mitogenome organization of Acharax sp. and compared the composition, relative synonymous codon usage (RSCU), and genetic distances with other available Solemyidae mitogenomes to evaluate the variation and conservation of mitogenomes among solemyid bivalves; (ⅱ) assess the intraspecific divergence of protobranch bivalves using the COX1 gene; (ⅲ) investigate the systematic status of solemyid bivalves in Bivalvia based on phylogenetic analyses. Since the only mitogenomes available within the Soleymida are all in the genus Solemya, we will further explore phylogenetic relationships within the Solemyida by targeting 3 nuclear and 2 mitochondrial genes. Lastly, we postulate that bivalves that live in the deep-sea are likely under different selection pressures due to life in an extreme environment than bivalves of shallower depths. Anatomical and physiological studies have shown that in order to adapt to the deep-sea environment, solemyid bivalves are significantly different from shallow protobranch bivalves in a series of physiological and biochemical aspects, such as the labial palp, digestive tract, and gills (Xu, 1999). Therefore, we speculate that the extreme deep-sea environment may affect the mitogenomes of solemyid bivalves. We will demonstrate this by evaluating the amino acid preferences of mitogenomes among bivalves from different depths, we were expect to see differences in the relative percentage of non-polar and polar amino acids between shallow water and deep-sea species.
2 MATERIAL AND METHOD 2.1 Sampling, DNA extraction, PCR amplification, and sequencingThe Acharax sp. was captured from the Haima methane seep in the northwestern slope of the South China Sea at 1 390 m using a remotely operated vehicle (ROV) in 2018. After being photographed onboard, the specimen was frozen in liquid nitrogen until DNA extraction. Morphological observations indicate that the specimen belonged to the solemyid genus Acharax sp. (Taylor et al., 2008; Oliver et al., 2011).
Total genomic DNA was extracted from the muscle tissues using TIANamp Marine Animals DNA Kit (TIANGEN, China) following the manufacturer's instructions. Three nuclear genes (18S rRNA, 28S rRNA, and H3) were amplified with primer pairs (Supplementary Table S1). PCR amplifications were carried out in 25-μL volume containing 12.5-μL 2X Premix Ex Taq (TaKaRa, China), 1-μL template DNA, 1 μL of each primer and 9.5-μL ddH2O. The cycling conditions were as follows: initial denaturation for 2 min at 94 ℃, followed by 35 cycles of denaturation at 94 ℃ for 1 min, annealing at 50 ℃ for 30 s, extension at 72 ℃ for 50 s, and a final extension at 72 ℃ for 10 min. PCR products were purified using the PCR clean-up Kit (Axygen). The purified PCR products were bidirectionally sequenced on ABI 3730XL DNA Analyzer.
2.2 Mitogenome sequencing, assembly, and annotationTotal genomic DNA was used for Illumina sequencing and Oxford Nanopore sequencing (Shanghai BIOZERON Co. Ltd.). The Illumina data was used to evaluate the complexity of the mitogenome and correct the Nanopore long reads. For Illumina sequencing, the high quality genomic DNA was fragmented to ~400 bp using the Covaris M220 system, used to construct short-insert libraries according to the instructions (TruSeqTM Nano DNA Sample Prep Kit, Illumina), and then sequenced on an Illumina NovaSeq 6000 platform with 150-bp paired-end reads length. Sequencing produced 4 217.1 MB of clean data. Clean data were obtained by using Trimmomatic 0.39 (http://www.usadellab.org/cms/index.php?page=trimmomatic). For Oxford Nanopore sequencing, gTube was used to break the genomic DNA, and long-read sequencing followed the protocol in the SQK-LSK109 genomic sequencing kit (ONT, Oxford, UK). Nanopore sequencing was performed with the GidION using the R9.4.1 flow cells.
For the mitogenome assembly, the ABySS (http://www.bcgsc.ca/platform/bioinfo/software/abyss) was used to do genome assembly with multiple-Kmer parameters and got the optimal results of the assembly. Then, canu (https://github.com/marbl/canu) was used to assemble the Nanopore corrected long reads. Finally, according to the paired-end and overlap relationships of reads, GapCloser (https://sourceforge.net/projects/soapdenovo2/files/GapCloser/) was subsequently applied to fill up the remaining local inner gaps and correct the single base polymorphism for the final assembly results. The circular mitogenome map of the Acharax sp. was drawn with Organellar Genome DRAW (Lohse et al., 2007).
The assembled mitogenome was annotated in the MITOS webserver (Bernt et al., 2013). The PCGs were analyzed with the ORF finder available on the NCBI (https://www.ncbi.nlm.nih.gov/orffinder/). The positions of the rRNA genes were delineated by the rRNAmmer webserver (https://services.healthtech.dtu.dk/service.php?RNAmmer-1.2). The tRNA genes were confirmed using the tRNAscan-SE webserver (Chan and Lowe, 2019).
2.3 Data analysisThe nucleotide composition, codon usage, and relative synonymous codon usage (RSCU) values of five Solemyidae mitogenomes (one newly sequenced and four previously published: ON023263, NC_ 034904, NC_034905, NC_034906, NC_017612) were analyzed by MEGA 7.0 (Kumar et al., 2016). Composition skew values were calculated using the following formulas: AT skew=(A–T)/(A+T) and GC skew=(G–C)/(G+C) (Perna and Kocher, 1995). The nucleotide diversity (Pi) and genetic distances (Kimura's 2-parameter) of 13 PCGs in Solemyidae mitogenomes were estimated by DnaSP 6.0 (Rozas et al., 2017) and MEGA 7.0, respectively. The rates of nonsynonymous to synonymous substitutions (Ka/Ks) of 13 PCGs of the five solemyids were also determined in DnaSP 6.0. The heterogeneities of the COX1 gene sequence divergence among the protobranch bivalves were evaluated by AliGROOVE (Kück et al., 2014).
The compositions of amino acids with different properties (nonpolar, polar uncharged, and polar charged) were compared between 18 deep-sea and 45 shallow water bivalves (Supplementary Table S2) with the PCGs of the complete mitogenomes. The pairwise differences and significance levels between the compared groups were evaluated by two-tailed t-tests in SPSS 16.0. Before analysis, the normality of the distributions of the data was assessed using the Kolmogorov-Smirnov test in SPSS 16.0. The results show that the data conform to normal distribution.
2.4 Gene order analysisThe putative molluscan ancestral pattern and the mitogenome order of Acharax sp. were pairwise compared to predict the mitogenome rearrangement events (e.g., transpositions, reverse transpositions, reversals, and tandem duplication random loss) using Common interval Rearrangement Explorer (CREx), heuristically determines mitochondrial rearrangement scenarios based on common intervals (Bernt et al., 2007).
2.5 Phylogenetic analysisThe phylogeny was performed based on the mitogenomes of Acharax sp. and 47 other bivalve species belonging to two subclasses, 12 orders (Supplementary Table S3). Two species of Polyplacophora served as outgroups. The nucleotide sequences of 13 mitochondrial PCGs were aligned using MAFFT version 7 webserver (Katoh et al., 2019) with default parameters. Ambiguously aligned regions were removed by Gblocks 0.91b (default setting) (Talavera and Castresana, 2007). Then, PhyloSuite 1.2.2 (Zhang et al., 2020b) was used to concatenate the trimmed alignments into a single dataset. The best partition schemes and optimal substitution models were inferred using PartitionFinder (Lanfear et al., 2016) (Supplementary Table S4). Phylogenetic relationships were inferred using both maximum likelihood (ML) and Bayesian inference (BI) methods. The ML tree was constructed by IQ-TREE (Nguyen et al., 2015), and branch support was assessed by ultrafast bootstrapping with 1 000 replicates (Hoang et al., 2018) as well as Bayesian-like transformation of the aLRT test (Anisimova et al., 2011). The Bayesian analysis was performed by MrBayes (Ronquist et al., 2012). Two independent runs were carried out with four Markov Monte Carlo chains for 1 000 000 generations started from a random tree, with sampling every 100 generations. The average standard deviation of split frequencies and the likelihood values were monitored, to determine whether the two runs converged onto the stationary distribution. The initial 25% of the trees were discarded as burn-in. The remaining trees were used to construct the 50% majority rule consensus tree and to estimate the Bayesian posterior probabilities (PP).
Then, phylogenetic relationships within Solemyida were assessed based on 2 mitochondrial (16S rRNA and COX1) and 3 nuclear (18S rRNA, 28S rRNA, and H3) gene sequences from 17 in-group species (Supplementary Table S5). Nucleotide sequences of each gene were aligned in batches using MAFFT Version 7 (Katoh et al., 2019), ambiguously aligned regions were deleted using Gblocks 0.91b (Talavera and Castresana, 2007); sequences were subsequently concatenated into a single alignment used to generate nexus files in PhyloSuite 1.2.2 (Zhang et al., 2020b). Maximum likelihood analysis was performed by the GTR+F+R3 substitution model in IQ-TREE 1.6.10 (Nguyen et al., 2015), and branches evaluated by ultrafast bootstrap (BP) with 1 000 replicates. All phylogenetic trees and node labels were graphically edited with iTOL (Letunic and Bork, 2007).
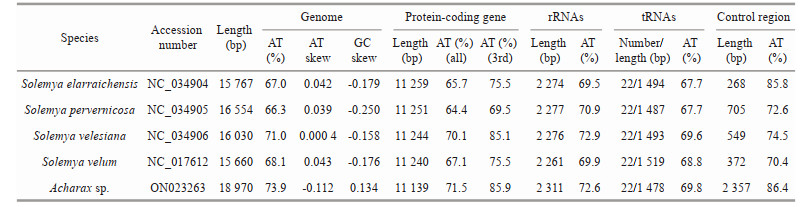
3 RESULT AND DISCUSSION 3.1 Mitogenome organization and characterizationAfter assembly, the complete mitogenome of Acharax sp. was obtained, with a length of 18 970 bp (GenBank accession number: ON023263). This length is the largest compared with other Solemya bivalves, which range from the 15 660 bp of S. velum (Plazzi et al., 2013) to the 16 554 bp of S. pervernicosa (Russell et al., 2018). Similar to most bivalve mitogenomes, the mitogenome of Acharax sp. contains 37 genes: 13 PCGs, 2 rRNA genes, and 22 tRNA genes. Eighteen genes (18 PCGs, 10 tRNAs) were encoded by the heavy (H) strand, while the remaining genes (5 PCGs, 2 rRNAs, and 12 tRNAs) were encoded by the light (L) strand (Fig. 1; Table 1).

|
| Fig.1 The organization of the mitogenome of Acharax sp. Genes for proteins and rRNAs are shown with standard abbreviations. Genes for tRNAs are represented by a single letter for the corresponding amino acid, with two leucine tRNAs and two serine tRNAs differentiated by numerals. |
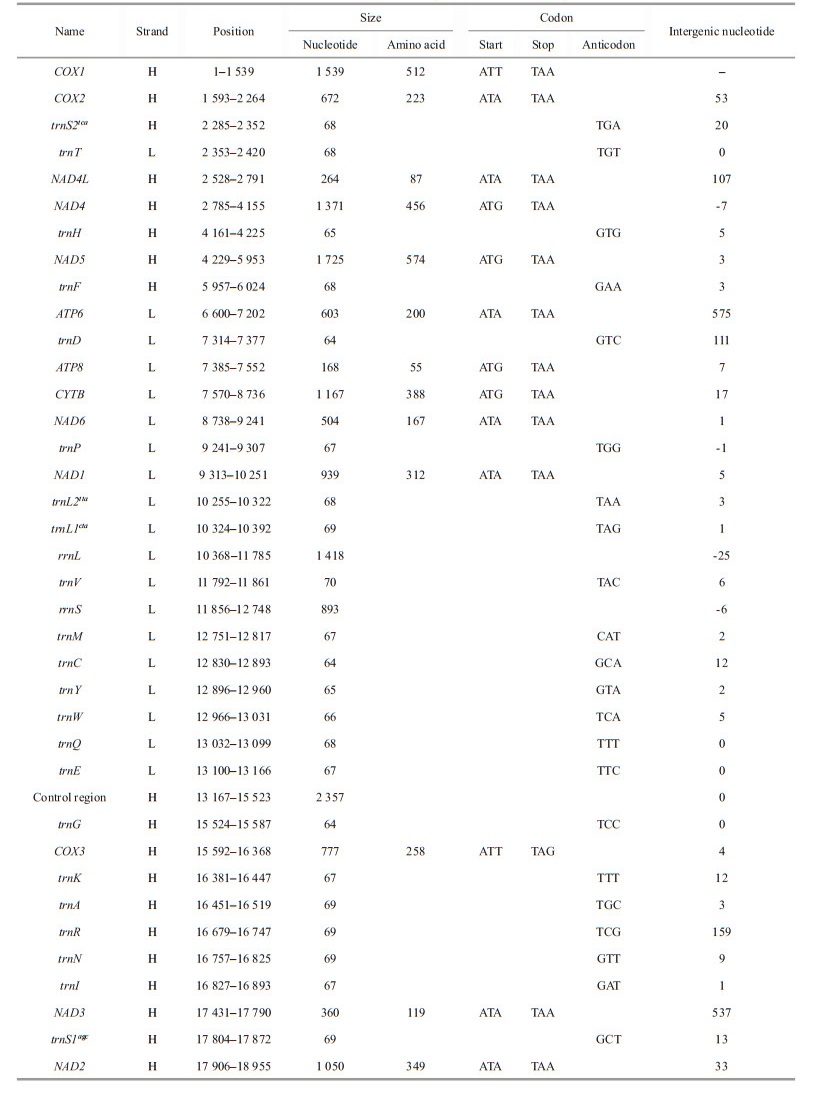
The nucleotide composition of the Acharax sp. mitogenome is as follows: A=32.80%, C=11.30%, G=14.80%, and T=41.10%. The GC content (26.10%) was significantly lower than the AT content (73.90%) (Table 2), and this AT richness was typical in other Solemyidae species (Table 3). Additionally, for the Acharax sp. mitogenome, the GC and AT skews were 0.134 and -0.112, respectively, which are opposite to the trends found in Solemya species and suggest a bias toward G and T (Table 3). Twenty-nine intergenic regions, totaling 4 066 bp, were scattered throughout the Acharax sp. mitogenome (Table 1). The longest noncoding region (2 357 bp) located between trnE and trnQ, which was identified as the putative control region (CR) and has high AT content (86.40%). Additionally, four overlaps were found between adjacent genes in the Acharax sp. mitogenome ranging from 1 bp to 25 bp (NAD4L/NAD4, NAD6/trnP, trnL1/rrnL, and trnV/rrnS).

The lengths of PCGs, rRNAs, tRNAs, and the CRs for the present five Solemyidae species were compared (Fig. 2). The CRs showed maximum length diversification, and this variation was considered responsible for the differences in the entire mitogenome length. In addition, the control region length in Acharax was longer than that in the Solemya species, in accordance with its longest mitogenome. Thus, even though they belong to the same family, there may be large length variation among species.

|
| Fig.2 The length of protein-coding genes (PCGs), tRNAs, rRNAs, and control regions among 5 Solemyidae mitogenomes |
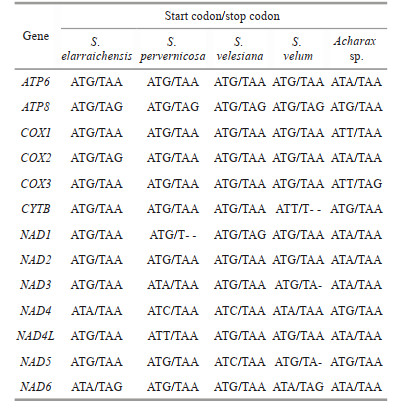
The combined length of 13 PCGs in the Acharax sp. mitogenome was 11 139 bp, accounting for 58.72% of the mitogenome (Fig. 2; Table 3). All PCGs of the present five Solemyidae mitogenomes started with ATD (ATA, ATG, and ATT) as initiation codons, and ATG was the most common (Table 4). Most PCGs ended with two conventional stop codons (TAA and TAG), while incomplete termination codons (TA/T) were detected (Table 4). TA was found in NAD5 of S. velum, and T was found in NAD1 of S. pervernicosa and CYTB of S. velum. Incomplete termination codons are common in metazoan mitogenomes, which can be corrected by post transcriptional polyadenylation (Dreyer and Steiner, 2006; Satoh et al., 2016).
Generally, the AT skew and GC skew are considered main indicators to measure the strand asymmetry and nucleotide composition (Lü et al., 2019). For the 13 PCGs of Acharax sp., the AT and GC skews were -0.203 and 0.134, respectively (Table 2), which demonstrates that A and C were more scarce than T and G. NAD3 has the lowest AT skew and highest GC skew. The equilibrium between selection pressure and mutation pressure in the process of replication and transcription might be the main reason for nucleotide skew (Wei et al., 2010). Here, NAD3 had a greater fluctuation in the AT skew and GC skew, indicating that its mutational and selection pressure might be different from the remaining PCGs.
The Acharax sp. mitogenome encodes a total of 3 699 amino acids. Leu was the most frequently used (15.49%), while Cys was the least frequently used amino acid (Supplementary Fig.S1). The use frequency for amino acids in S. elarraichensis, S. pervernicosa, S. velesiana, and S. velum were very similar (Supplementary Fig.S1).
Numerous studies have indicated that metazoan mitogenomes often have a preference toward a higher representation of A and T, which results in a subsequent bias of the corresponding amino acids (Salvato et al., 2008; Wang et al., 2016b). The AT content of PCGs in Acharax sp. was 71.5%, the third codon position was especially A+T rich (85.9%), which was similar to the four previously published Solemya bivalves (Table 3). RSCU further demonstrated nucleotide composition bias in those aforementioned Solemyidae mitogenomes. In Acharax sp. and four published Solemya mitogenomes, the RSCU values of NNA and NNU are usually > 1 (Fig. 3), suggesting a strong AT bias in the third codon. This result supports the hypothesis that in mitogenomes the AT bias of the third codon might be correlated positively with the codon usage bias (Hao et al., 2012; Li et al., 2019a; Kou et al., 2020).

|
| Fig.3 RSCU in mitogenomes of Acharax sp. and four other Solemyidae bivalves Codon families are plotted below the x-axis. |
In a comparison of the five Sloemyidae mitogenomes (Acharax sp., S. elarraichensis, S. pervernicosa, S. velesiana, and S. velum), the nucleotide diversity values were highly variable among the 13 PCGs (Fig. 4). In the 13 PCGs, NAD2 (Pi=0.337), ATP8 (Pi=0.319), and NAD6 (Pi=0.318) presented high level of polymorphisms; while COX1 (Pi=0.175) and COX2 (Pi=0.219) were the most conserved genes, which had relatively low diversity values.

|
| Fig.4 Nucleotide diversity (Pi) of 13 PCGs of the present five Solemyidae bivalves The blue curve shows Pi value in sliding window analysis. |
To reveal the divergence of the PCGs among solemyid bivalves, the pairwise genetic distances were calculated (Fig. 5). The results showed that the genetic distance at the third nucleotide position was significantly higher than that at the first+second nucleotide position, suggesting that the evolution of the first and second positions was slower than that of the third position. The highest genetic distances were detected in ATP6 (1.739) and NAD2 (1.345) at the third nucleotide of codons, while explored in ATP8 (0.564) based on the first+second nucleotide position (Fig. 5). The COX1 and NAD1 showed low genetic distance in both the first+second and third codon analyses, which indicated that they might have low evolutionary rates among the solemyid bivalves, while those of NAD2, NAD5, and ATP6 were high (Fig. 5).

|
| Fig.5 The pair genetic distances of 13 PCGs among five Solemyidae bivalves Asp: Acharax sp.; Se: Solemya elarraichensis; Sp: Solemya pervernicosa; Sva: Solemya velesiana; Svm: Solemya velum. |
The AliGROOVE analysis of the COX1 gene sequences for 66 protobranch bivalves showed strongly divergent patterns among species of different orders and thus they can be used for further phylogenetic studies of Protobranchia. The interspecific genetic divergence of COX1 between Acharax sp. and congeneric species A. johnsoni was 19.6%, and the average interfamilial genetic divergence was 24.9% (Fig. 6).

|
| Fig.6 AliGROOVE analysis of COX1 gene sequences for 66 protobranch bivalves considering their nucleotide composition The site scores ranged from +1, indicating great difference to other sequence composition (blue), to -1, indicating similarity in sequence composition (red). |
The value of nonsynonymous substitution (Ka)/synonymous substitution (Ks) is a common index to evaluate the selection pressure of species in molecular evolution (Zhu et al., 2017). Ka/Ks < 1, =1, and > 1 indicate purifying selection, neutrality, and positive selection, respectively (Yang and Bielawski, 2000). Mitochondria are the main place of aerobic respiration, being important for energy metabolism and are strongly functionally constrained; therefore, purifying selection is considered the dominant force in mitogenome evolution (Tomasco and Lessa, 2011). All 13 PCGs of five Solemyidae mitogenomes were under powerful purifying selection with Ka/Ks values far less than 1. The ATP8 and NAD6 genes had high Ka/Ks values (mean: 0.305, 0.235) compared to other genes, while those of the COX1 and COX3 genes were low (Fig. 7). Researchers have suggested that due to DNA repair mechanisms, low mutation rates tend to occur in highly expressed genes (Barrientos et al., 2002). That is, COX1 and COX3, which have low Ka/Ks, may have higher expression levels than other mitochondrial genes.

|
| Fig.7 The Ka/Ks ratios for each PCG in pairwise mitogenome of Acharax sp. (Asp), S. elarraichensis (Se), S. pervernicosa (Sp), S. velesiana (Sva), and S. velum (Svm) "NO" means no numerical value. |
However, weak and/or episodic positive selection may occur against this background of strong purifying selection under extremely harsh environments. Studies have found evidence of unique evolutionary processes and adaptations of mitochondrial PCGs, such as the ATP synthase genes of the artiodactylian tribe Caprini and Tibetan loaches (Hassanin et al., 2009; Wang et al., 2016a), the cytochrome b gene in alpaca living at high altitudes (da Fonseca et al., 2008), the cytochrome c oxidase genes of Tibetan antelope and plateau pika (Xu et al., 2005; Luo et al., 2008), the NADH dehydrogenase genes of Tibetan horses and high altitude snub-nosed monkeys (Xu et al., 2007; Yu et al., 2011). Similarly, the deep-sea is a harsh environment characterized by high hydrostatic pressure, hypoxia, darkness, and low temperature (Rex, 1981). Positively selected sites were also identified in mitogenomes of deep-sea organisms (Zhang et al., 2017a, 2020a; Sun et al., 2018; Yang et al., 2021). Bivalvia is among the most diverse molluscan classes, inhabiting various aquatic environments, from shallow continental shelves to the deep sea (Bieler et al., 2013; Lemer et al., 2019). Inhabitants living in different depth ranges would suffer to varying degree from the effects exerted by hydrostatic and temperature pressures. In order to study how mitochondria adapted to the aforementioned pressures, the amino acid constitutions of PCGs were compared between bivalves from shallow water (45 species) and the deep sea (18 species). The results showed that the nonpolar amino acids in the PCGs of these deep-sea mitogenomes (56.74%) were markedly more plentiful than those from the shallow water (55.48%) (P < 0.01) (Fig. 8a); accordingly, the percentages of polar uncharged amino acids and charged amino acids were markedly lower in the deep-sea batch (P < 0.05) (Fig. 8b, c).

|
| Fig.8 Statistics of amino acids composition in mitochondrial PCGs of bivalves from different habitats Significance tests were performed between 18 deep-sea and 45 shallow water bivalves regarding the percentages of nonpolar (a), polar uncharged (b), and charged (c) amino acids in mitochondrial PCGs. |
Previous studies noted that the the function of proteins is affected by the composition and properties of amino acids (Metpally and Reddy, 2009; Yang et al., 2015). Our research revealed significant differences in nonpolar amino acid compositions between deep-sea bivalves PCGs and those of shallow water. Studies of amino acid composition in deep-sea amphipods have also obtained similar results, that is, with the increase of depth, the proportion of nonpolar amino acids in the mitochondrial PCGs of deep-sea amphipods present an increasing trend (Li et al., 2019b). The protein products of mitochondrial coding genes are embedded in the hydrophobic lipid chains of the mitochondrial membrane, and an increase proportion of nonpolar amino acids would contribute to compact interactions between lipid chains and membrane proteins (Li et al., 2019b). Recently, the adaptive molecular mechanisms of organisms in the deep-sea environment have already come to the attention of researchers. In addition to the differences in amino acids composition and properties, amino acid substitutions of certain proteins have also been found in the mitochondria of deep-sea scale worms, vesicomyids, crabs, starfish, snailfish, and so on (Zhang et al., 2017b, 2020a; Mu et al., 2018; Wang et al., 2019; Yang et al., 2019), which provides strong evidence of adaptive changes in mitogenomes of the deep-sea organisms.
3.5 RNA geneThe classical set of 22 tRNAs was detected in Acharax sp. mitogenome, with size ranging of 64 (trnD)–70 bp (trnV) (Table 1). The total length, A+T content, and AT skew of the 22 tRNAs in Acharax sp. mitogenome were 1 478 bp, 69.8% and 0.026, respectively (Tables 2 & 3). The secondary structure of 22 tRNAs were schematized in Supplementary Fig. S2. Furthermore, many noncomplementary and T-G base pairs were detected in the stem regions of the tRNA genes, which seem to be universal phenomena in many organisms and could be repaired through post-transcriptional editing (Lavrov et al., 2000).
Two ribosomal RNA genes (rrnS and rrnL) of Acharax sp. are located on the L strand, with lengths of 893 bp (AT%=70.6%) and 1 418 bp (AT%=73.8%), respectively. rrnS is located between trnV and trnM, and rrnL is located between trnL1cta and trnV, and the pattern rrnL-trnV-rrnS has also been found in the four previously published solemyid mitogenomes (Plazzi et al., 2013; Russell et al., 2018). A comparison of the 22 tRNA and 2 rRNA genes among solemyids indicated an extremely high similarity in different species from the same family (Table 3).
3.6 Gene rearrangementGene order rearrangements in molluscs have been discussed in detail in numerous studies (Cunha et al., 2009; Guerra et al., 2018; Uribe et al., 2018; Zhang et al., 2021) and vary widely within and among classes and orders. However, within Protobranchia, only gene order patterns of five species have been published previously. Among them, S. elarraichensis, S. velesiana, S. velum, and Acharax sp. shared identical mitochondrial gene orders, while S. pervernicosa showed differences in the arrangement of trnT.
Compared to the molluscan ancestral pattern, at least ten genes were rearranged in Acharax sp. mitogenome. In the mitogenomes of more primitive taxa, trnD is located between COX2 and ATP8, but in Acharax sp. it was found between ATP6 and ATP8. In addition, the trnD-ATP8-ATP6-trnF-NAD5-trnH-NAD4-NAD4L-trnT-trnS2 cluster and trnP were involved in shifting between two strands (Fig. 9) (Plazzi et al., 2013). trnG and trnE have switched places, and trnG moved to the H strand. Furthermore, based on CREx analysis, gene rearrangement scenarios were deduced from the putative ancestral molluscan pattern to Acharax sp., being the result of consecutive events of transposition/reverse transposition and reversal (Fig. 9).

|
| Fig.9 The rearrangement scenarios deduced from the molluscan ancestral pattern to Acharax sp. by CREx analysis |
The Protobranchia are intriguing bivalves in terms of early evolution, unique anatomy, and ecological diversification in deep sea (Zardus, 2002; Sharma et al., 2013). However, owing to lack of prominent shell characteristics and difficulties in collecting live material, the higher systematics and evolutionary history of Protobranchia have long been controversial. Recently, based on larger taxon sampling and sequence data from molecular loci, the monophyly of Protobranchia has been supported (Lemer et al., 2019; Sato et al., 2020). Here, the phylogenetic reconstruction of bivalve lineages based on nucleotide sequences of 13 PCGs by ML and BI resulted in almost identical topologies. As a representative of Protobranchia, Solemyida was monophyletic and at the most basal position (Fig. 10). Then, we performed phylogenetic analyses based on sequence data of nuclear 18S rRNA, 28S rRNA, H3, and mitochondrial 16S rRNA, and the COX1 genes of solemyids. In Solemyoidea, the two genera Acharax and Solemya formed a monophyletic clade each. Acharax sp. clustered with other Acharax bivalves with high bootstrap support values (Fig. 11).

|
| Fig.10 Phylogenetic tree deduced from the nucleotide sequences of 13 PCGs by Bayesian and ML methods The triangles indicate both posterior probabilities and bootstrap values ³0.95 for the nodes. |

|
| Fig.11 Phylogenetic relationships of Solemyida by the ML analysis of mitochondrial (16S rRNA+COX1) and nuclear (18S rRNA+28S rRNA+H3) sequences The black stars demonstrate bootstrap values ≥95% for the node. |
Considering that the present taxon coverage of existing mitogenomic trees is undeniably limited, the higher systematics of Protobranchia remains less clear. Deeper phylogenomic focus on this group is urgently needed, especially among members of Nuculida and Nuculanida. Hence, more comprehensive taxon samplings and mitogenomes from Protobranchia are needed to move us closer to the goal of reconstructing the natural evolutionary history of protobranch bivalves.
4 CONCLUSIONIn the present study, the complete mitogenome Acharax sp. was determined and compared with other available mitogenomes of solemyids. The mitogenome of Acharax sp. is 18 970 bp in length and encoded 37 typical mitochondrial genes. The Ka/Ks ratio analyses indicated that five Solemyidae mitogenomes were suffering powerful purifying selection with Ka/Ks values far less than 1. Compared to 45 existing shallow water equivalents, the 18 accessible mitogenomes from the deep sea, including the Acharax sp., show significantly more nonpolar amino acids in the 13 PCGs, which may be a clue of an adaptation to the deep-sea environment. Compared to the molluscan ancestral pattern, at least 10 genes were rearranged in Acharax sp. mitogenome, as a result of consecutive events of transposition/reverse transposition and reversal. Phylogenetic analysis supported that Solemyida monophyletic and Acharax sp. clustered with other Acharax bivalves with high support values. The data presented here provides new information about mitogenome organization, adaptive characters, and phylogenetic position for solemyids, which may shed light on the understanding of the mitogenomic adaptation and evolution in protobranch bivalves.
5 DATA AVAILABILITY STATEMENTThe sequence data that support the findings of this study are openly available in GenBank of NCBI at https://www.ncbi.nlm.nih.gov.
6 ACKNOWLEDGMENTThe authors thank the captain and crew of the R/V Tan Suo Yi Hao and the pilots of the HOV Shen Hai Yong Shi for providing technical support and thank the Center for Ocean Mega-Science, Chinese Academy of Sciences.
Electronic supplementary material
Supplementary material (Supplementary Tables S1–S5 and Figs.S1–S2) is available in the online version of this article at https://doi.org/10.1007/s00343-022-2217-8.
Anisimova M, Gil M, Dufayard J F, et al. 2011. Survey of branch support methods demonstrates accuracy, power, and robustness of fast likelihood-based approximation schemes. Systematic Biology, 60(5): 685-699.
DOI:10.1093/sysbio/syr041 |
Barrientos A, Barros M H, Valnot I, et al. 2002. Cytochrome oxidase in health and disease. Gene, 286(1): 53-63.
DOI:10.1016/S0378-1119(01)00803-4 |
Bernt M, Donath A, Jühling F, et al. 2013. MITOS: improved de novo metazoan mitochondrial genome annotation. Molecular Phylogenetics and Evolution, 69(2): 313-319.
DOI:10.1016/j.ympev.2012.08.023 |
Bernt M, Merkle D, Ramsch K, et al. 2007. CREx: inferring genomic rearrangements based on common intervals. Bioinformatics, 23(21): 2957-2958.
DOI:10.1093/bioinformatics/btm468 |
Bieler R, Mikkelsen P M, Giribet G. 2013. Bivalvia-A discussion of known unknowns. American Malacological Bulletin, 31(1): 123-133.
DOI:10.4003/006.031.0105 |
Boore J L. 1999. Animal mitochondrial genomes. Nucleic Acids Research, 27(8): 1767-1780.
DOI:10.1093/nar/27.8.1767 |
Chan P P, Lowe T M. 2019. tRNAscan-SE: searching for tRNA genes in genomic sequences. In: Kollmar M ed. Gene Prediction: Methods and Protocols. Humana, New York. p. 1-14, https://doi.org/10.1007/978-1-4939-9173-0_1.
|
Conway N M, Howes B L, McDowell Capuzzo J E, et al. 1992. Characterization and site description of Solemya borealis (Bivalvia; Solemyidae), another bivalve-bacteria symbiosis. Marine Biology, 112(4): 601-613.
DOI:10.1007/BF00346178 |
Cunha R L, Grande C, Zardoya R. 2009. Neogastropod phylogenetic relationships based on entire mitochondrial genomes. BMC Evolutionary Biology, 9: 210.
DOI:10.1186/1471-2148-9-210 |
da Fonseca R R, Johnson W E, O'Brien S J, et al. 2008. The adaptive evolution of the mammalian mitochondrial genome. BMC Genomics, 9: 119.
DOI:10.1186/1471-2164-9-119 |
Dreyer H, Steiner G. 2006. The complete sequences and gene organisation of the mitochondrial genomes of the heterodont bivalves Acanthocardia tuberculata and Hiatella arctica-and the first record for a putative Atpase subunit 8 gene in marine bivalves. Frontiers in Zoology, 3: 13.
DOI:10.1186/1742-9994-3-13 |
Fisher C R, Childress J J. 1986. Translocation of fixed carbon from symbiotic bacteria to host tissues in the gutless bivalve Solemya reidi. Marine Biology, 93(1): 59-68.
DOI:10.1007/BF00428655 |
Fujiwara Y. 2003. Symbiotic adaptation for deeper habitats in chemosynthetic environments. Journal of Geography (Chigaku Zasshi), 112(2): 302-308.
DOI:10.5026/jgeography.112.2_302 |
Fukasawa Y, Matsumoto H, Beppu S, et al. 2017. Molecular phylogenetic analysis of chemosymbiotic Solemyidae and Thyasiridae. Open Journal of Marine Science, 7(1): 124-141.
DOI:10.4236/ojms.2017.71010 |
Guerra D, Bouvet K, Breton S. 2018. Mitochondrial gene order evolution in Mollusca: inference of the ancestral state from the mtDNA of Chaetopleura apiculata (polyplacophora, chaetopleuridae). Molecular Phylogenetics and Evolution, 120: 233-239.
DOI:10.1016/j.ympev.2017.12.013 |
Hao J S, Sun Q Q, Zhao H B, et al. 2012. The complete mitochondrial genome of Ctenoptilum vasava (Lepidoptera: Hesperiidae: Pyrginae) and its phylogenetic implication. Comparative and Functional Genomics, 2012: 328049.
DOI:10.1155/2012/328049 |
Hassanin A, Ropiquet A, Couloux A, et al. 2009. Evolution of the mitochondrial genome in mammals living at high altitude: new insights from a study of the tribe Caprini (Bovidae, Antilopinae). Journal of Molecular Evolution, 68(4): 293-310.
DOI:10.1007/s00239-009-9208-7 |
Hoang D T, Chernomor O, von Haeseler A, et al. 2018. UFBoot2:improving the ultrafast bootstrap approximation. Molecular Biology and Evolution, 35(2): 518-522.
DOI:10.1093/molbev/msx281 |
Kamenev G M. 2009. North Pacific species of the genus Solemya Lamarck, 1818 (Bivalvia: Solemyidae), with notes on Acharax johnsoni (Dall, 1891). Malacologia, 51(2): 233-261.
DOI:10.4002/040.051.0202 |
Katoh K, Rozewicki J, Yamada K D. 2019. MAFFT online service: multiple sequence alignment, interactive sequence choice and visualization. Briefings in Bioinformatics, 20(4): 1160-1166.
DOI:10.1093/bib/bbx108 |
Kou Q, Xu P, Poore G C B, et al. 2020. A new species of the deep-sea sponge-associated genus Eiconaxius (Crustacea: Decapoda: Axiidae), with new insights into the distribution, speciation, and mitogenomic phylogeny of axiidean shrimps. Frontiers in Marine Science, 7: 469.
DOI:10.3389/fmars.2020.00469 |
Kück P, Meid S A, Groß C, et al. 2014. AliGROOVE-visualization of heterogeneous sequence divergence within multiple sequence alignments and detection of inflated branch support. BMC Bioinformatics, 15(1): 294.
DOI:10.1186/1471-2105-15-294 |
Kumar S, Stecher G, Tamura K. 2016. MEGA7:molecular evolutionary genetics analysis version 7.0 for bigger datasets. Molecular Biology and Evolution, 33(7): 1870-1874.
DOI:10.1093/molbev/msw054 |
Lanfear R, Frandsen P B, Wright A M, et al. 2016. PartitionFinder 2:new methods for selecting partitioned models of evolution for molecular and morphological phylogenetic analyses. Molecular Biology and Evolution, 34: 772-773.
DOI:10.1093/molbev/msw260 |
Lavrov D V, Brown W M, Boore J L. 2000. A novel type of RNA editing occurs in the mitochondrial tRNAs of the centipede Lithobius forficatus. Proceedings of the National Academy of Sciences of the United States of America, 97(25): 13738-13742.
DOI:10.1073/pnas.250402997 |
Lemer S, Bieler R, Giribet G. 2019. Resolving the relationships of clams and cockles: dense transcriptome sampling drastically improves the bivalve tree of life. Proceedings of the Royal Society B: Biological Sciences, 286(1896): 20182684.
DOI:10.1098/rspb.2018.2684 |
Letunic I, Bork P. 2007. Interactive tree of life (iTOL): an online tool for phylogenetic tree display and annotation. Bioinformatics, 23(1): 127-128.
DOI:10.1093/bioinformatics/btl529 |
Li J, Zhao Y Q, Lin R R, et al. 2019a. Mitochondrial genome characteristics of Somena scintillans (Lepidoptera: Erebidae) and comparation with other Noctuoidea insects. Genomics, 111(6): 1239-1248.
DOI:10.1016/j.ygeno.2018.08.003 |
Li J Y, Song Z L, Yan G Y, et al. 2019b. The complete mitochondrial genome of the largest amphipod, Alicella gigantea: insight into its phylogenetic relationships and deep sea adaptive characters. International Journal of Biological Macromolecules, 141: 570-577.
DOI:10.1016/j.ijbiomac.2019.09.050 |
Liu H Y, Yang Y, Sun S E, et al. 2020. Mitogenomic phylogeny of the Naticidae (Gastropoda: Littorinimorpha) reveals monophyly of the Polinicinae. Zoologica Scripta, 49(3): 295-306.
DOI:10.1111/zsc.12412 |
Lohse M, Drechsel O, Bock R. 2007. OrganellarGenomeDRAW (OGDRAW): a tool for the easy generation of high-quality custom graphical maps of plastid and mitochondrial genomes. Current Genetics, 52(5): 267-274.
DOI:10.1007/s00294-007-0161-y |
Luo Y J, Gao W X, Gao Y Q, et al. 2008. Mitochondrial genome analysis of Ochotona curzoniae and implication of cytochrome c oxidase in hypoxic adaptation. Mitochondrion, 8(5-6): 352-357.
DOI:10.1016/j.mito.2008.07.005 |
Lü Z M, Zhu K H, Jiang H, et al. 2019. Complete mitochondrial genome of Ophichthus brevicaudatus reveals novel gene order and phylogenetic relationships of Anguilliformes. International Journal of Biological Macromolecules, 135: 609-618.
DOI:10.1016/j.ijbiomac.2019.05.139 |
Metpally R P R, Reddy B V B. 2009. Comparative proteome analysis of psychrophilic versus mesophilic bacterial species: insights into the molecular basis of cold adaptation of proteins. BMC Genomics, 10: 11.
DOI:10.1186/1471-2164-10-11 |
Mu W D, Liu J, Zhang H B. 2018. The first complete mitochondrial genome of the Mariana Trench Freyastera benthophila (Asteroidea: Brisingida: Brisingidae) allows insights into the deep-sea adaptive evolution of Brisingida. Ecology and Evolution, 8(22): 10673-10686.
DOI:10.1002/ece3.4427 |
Neulinger S C, Sahling H, Süling J, et al. 2006. Presence of two phylogenetically distinct groups in the deep-sea mussel Acharax (Mollusca: Bivalvia: Solemyidae). Marine Ecology Progress Series, 312: 161-168.
DOI:10.3354/meps312161 |
Nguyen L T, Schmidt H A, von Haeseler A, et al. 2015. IQ-TREE: a fast and effective stochastic algorithm for estimating maximum-likelihood phylogenies. Molecular Biology and Evolution, 32(1): 268-274.
DOI:10.1093/molbev/msu300 |
Oliver G, Rodrigues C F, Cunha M R. 2011. Chemosymbiotic bivalves from the mud volcanoes of the Gulf of Cadiz, NE Atlantic, with descriptions of new species of Solemyidae, Lucinidae and Vesicomyidae. ZooKeys, 113: 1-38.
DOI:10.3897/zookeys.113.1402 |
Perna N T, Kocher T D. 1995. Patterns of nucleotide composition at fourfold degenerate sites of animal mitochondrial genomes. Journal of Molecular Evolution, 41(3): 353-358.
DOI:10.1007/BF00186547 |
Plazzi F, Ribani A, Passamonti M. 2013. The complete mitochondrial genome of Solemya velum (Mollusca: Bivalvia) and its relationships with Conchifera. BMC Genomics, 14: 409.
DOI:10.1186/1471-2164-14-409 |
Pojeta J J. 1988. The origin and Paleozoic diversification of Solemyoid Pelecypods. New Mexico Bureau of Mines and Mineral Resources, Memoir, 44: 201-271.
|
Rahuman S, Jeena N S, Asokan P K, et al. 2020. Mitogenomic architecture of the multivalent endemic black clam (Villorita cyprinoides) and its phylogenetic implications. Scientific Reports, 10(1): 15438.
DOI:10.1038/s41598-020-72194-1 |
Rex M A. 1981. Community structure in the deep-sea Benthos. Annual Review of Ecology and Systematics, 12: 331-353.
DOI:10.1146/annurev.es.12.110181.001555 |
Rodrigues C F, Webster G, Cunha M R, et al. 2010. Chemosynthetic bacteria found in bivalve species from mud volcanoes of the Gulf of Cadiz. FEMS Microbiology Ecology, 73(3): 486-499.
DOI:10.1111/j.1574-6941.2010.00913.x |
Ronquist F, Teslenko M, van der Mark P, et al. 2012. MrBayes 3.2:efficient Bayesian phylogenetic inference and model choice across a large model space. Systematic Biology, 61(3): 539-542.
DOI:10.1093/sysbio/sys029 |
Rozas J, Ferrer-Mata A, Sánchez-DelBarrio J C, et al. 2017. DnaSP 6:DNA sequence polymorphism analysis of large data sets. Molecular Biology and Evolution, 34(12): 3299-3302.
DOI:10.1093/molbev/msx248 |
Russell S L, McCartney E, Cavanaugh C M. 2018. Transmission strategies in a chemosynthetic symbiosis: detection and quantification of symbionts in host tissues and their environment. Proceedings of the Royal Society B: Biological Sciences, 285(1890): 20182157.
DOI:10.1098/rspb.2018.2157 |
Saether K P, Sha J G, Little C T S, et al. 2016. New records and a new species of bivalve (Mollusca: Bivalvia) from Miocene hydrocarbon seep deposits, North Island, New Zealand. Zootaxa, 4154(1): 1-26.
DOI:10.11646/zootaxa.4154.1.1 |
Salvato P, Simonato M, Battisti A, et al. 2008. The complete mitochondrial genome of the bag-shelter moth Ochrogaster lunifer (Lepidoptera, Notodontidae). BMC Genomics, 9: 331.
DOI:10.1186/1471-2164-9-33 |
Sato K, Kano Y, Setiamarga D H E, et al. 2020. Molecular phylogeny of protobranch bivalves and systematic implications of their shell microstructure. Zoologica Scripta, 49(4): 458-472.
DOI:10.1111/zsc.12419 |
Sato K, Nakashima R, Majima R, et al. 2013. Shell microstructures of five recent solemyids from Japan (Mollusca: Bivalvia). Paleontological Research, 17(1): 69-90.
DOI:10.2517/1342-8144-17.1.69 |
Satoh T P, Miya M, Mabuchi K, et al. 2016. Structure and variation of the mitochondrial genome of fishes. BMC Genomics, 17: 719.
DOI:10.1186/s12864-016-3054-y |
Seike K, Jenkins R G, Watanabe H, et al. 2012. Novel use of burrow casting as a research tool in deep-sea ecology. Biology Letters, 8(4): 648-651.
DOI:10.1098/rsbl.2011.1111 |
Sharma P P, Zardus J D, Boyle E E, et al. 2013. Into the Deep: a phylogenetic approach to the bivalve subclass Protobranchia. Molecular Phylogenetics and Evolution, 69(1): 188-204.
DOI:10.1016/j.ympev.2013.05.018 |
Sun S E, Sha Z L, Wang Y R. 2018. Complete mitochondrial genome of the first deep-sea spongicolid shrimp Spongiocaris panglao (Decapoda: Stenopodidea): novel gene arrangement and the phylogenetic position and origin of Stenopodidea. Gene, 676: 123-138.
DOI:10.1016/j.gene.2018.07.026 |
Talavera G, Castresana J. 2007. Improvement of phylogenies after removing divergent and ambiguously aligned blocks from protein sequence alignments. Systematic Biology, 56(4): 564-577.
DOI:10.1080/10635150701472164 |
Taylor J D, Glover E A, Williams S T. 2008. Ancient chemosynthetic bivalves: systematics of Solemyidae from eastern and southern Australia (Mollusca: Bivalvia). Memoirs Queensland Museum-Nature, 54(1): 75-104.
|
Tomasco I H, Lessa E P. 2011. The evolution of mitochondrial genomes in subterranean caviomorph rodents: adaptation against a background of purifying selection. Molecular Phylogenetics and Evolution, 61(1): 64-70.
DOI:10.1016/j.ympev.2011.06.014 |
Uribe J E, Zardoya R, Puillandre N. 2018. Phylogenetic relationships of the conoidean snails (Gastropoda: Caenogastropoda) based on mitochondrial genomes. Molecular Phylogenetics and Evolution, 127: 898-906.
DOI:10.1016/j.ympev.2018.06.037 |
Walton K. 2015. New Zealand living Solemyidae (Bivalvia: Protobranchia). Molluscan Research, 35(4): 246-261.
DOI:10.1080/13235818.2015.1053168 |
Wang K, Shen Y J, Yang Y Z, et al. 2019. Morphology and genome of a snailfish from the Mariana Trench provide insights into deep-sea adaptation. Nature Ecology & Evolution, 3(5): 823-833.
DOI:10.1038/s41559-019-0864-8 |
Wang Y, Shen Y J, Feng C G, et al. 2016a. Mitogenomic perspectives on the origin of Tibetan loaches and their adaptation to high altitude. Scientific Reports, 6: 29690.
DOI:10.1038/srep29690 |
Wang Z L, Li C, Fang W Y, et al. 2016b. The complete mitochondrial genome of two Tetragnatha spiders (Araneae: Tetragnathidae): severe truncation of tRNAs and novel gene rearrangements in Araneae. International Journal of Biological Sciences, 12(1): 109-119.
DOI:10.7150/ijbs.12358 |
Wei S J, Shi M, Chen X X, et al. 2010. New views on strand asymmetry in insect mitochondrial genomes. PLoS One, 5(9): e12708.
DOI:10.1371/journal.pone.0012708 |
Xu F S. 1999. Fauna Sinica: Phylum Mollusca: Class Bivalvia: Subclass Protobranchia and Anomalodesmata. Science Press, Beijing. p.1-244.
(in Chinese)
|
Xu S Q, Luosang J, Hua S, et al. 2007. High altitude adaptation and phylogenetic analysis of Tibetan horse based on the mitochondrial genome. Journal of Genetics and Genomics, 34(8): 720-729.
DOI:10.1016/S1673-8527(07)60081-2 |
Xu S Q, Yang Y Z, Zhou J, et al. 2005. A mitochondrial genome sequence of the Tibetan antelope (Pantholops hodgsonii). Genomics, Proteomics & Bioinformatics, 3(1): 5-17.
DOI:10.1016/S1672-0229(05)03003-2 |
Yang L L, Tang S K, Huang Y, et al. 2015. Low temperature adaptation is not the opposite process of high temperature adaptation in terms of changes in amino acid composition. Genome Biology and Evolution, 7(12): 3426-3433.
DOI:10.1093/gbe/evv232 |
Yang M, Dong D, Li X Z. 2021. The complete mitogenome of Phymorhynchus sp. (Neogastropoda, Conoidea, Raphitomidae) provides insights into the deep-sea adaptive evolution of Conoidea. Ecology and Evolution, 11(12): 7518-7531.
DOI:10.1002/ece3.7582 |
Yang M, Gong L, Sui J X, et al. 2019. The complete mitochondrial genome of Calyptogena marissinica (Heterodonta: Veneroida: Vesicomyidae): insight into the deep-sea adaptive evolution of vesicomyids. PLoS One, 14(9): e0217952.
DOI:10.1371/journal.pone.0217952 |
Yang Z H, Bielawski J P. 2000. Statistical methods for detecting molecular adaptation. Trends in Ecology & Evolution, 15(12): 496-503.
DOI:10.1016/S0169-5347(00)01994-7 |
Yu L, Wang X P, Ting N, et al. 2011. Mitogenomic analysis of Chinese snub-nosed monkeys: evidence of positive selection in NADH dehydrogenase genes in high-altitude adaptation. Mitochondrion, 11(3): 497-503.
DOI:10.1016/j.mito.2011.01.004 |
Zardus J D. 2002. Protobranch bivalves. Advances in Marine Biology, 42: 1-65.
DOI:10.1016/S0065-2881(02)42012-3 |
Zhang B, Wu Y Y, Wang X, et al. 2020a. Comparative analysis of mitochondrial genome of a deep-sea crab Chaceon granulates reveals positive selection and novel genetic features. Journal of Oceanology and Limnology, 38(2): 427-437.
DOI:10.1007/s00343-019-8364-x |
Zhang B, Zhang Y H, Wang X, et al. 2017a. The mitochondrial genome of a sea anemone Bolocera sp. exhibits novel genetic structures potentially involved in adaptation to the deep-sea environment. Ecology and Evolution, 7(13): 4951-4962.
DOI:10.1002/ece3.3067 |
Zhang D, Gao F L, Jakovlić I, et al. 2020b. PhyloSuite: an integrated and scalable desktop platform for streamlined molecular sequence data management and evolutionary phylogenetics studies. Molecular Ecology Resources, 20(1): 348-355.
DOI:10.1111/1755-0998.13096 |
Zhang K, Sun J, Xu T, et al. 2021. Phylogenetic relationships and adaptation in deep-sea mussels: insights from mitochondrial genomes. International Journal of Molecular Sciences, 22(4): 1900.
DOI:10.3390/ijms22041900 |
Zhang Y J, Sun J, Chen C, et al. 2017b. Adaptation and evolution of deep-sea scale worms (Annelida: Polynoidae): insights from transcriptome comparison with a shallow-water species. Scientific Reports, 7: 46205.
DOI:10.1038/srep46205 |
Zhu K C, Liang Y Y, Wu N, et al. 2017. Sequencing and characterization of the complete mitochondrial genome of Japanese Swellshark (Cephalloscyllium umbratile). Scientific Reports, 7: 15299.
DOI:10.1038/s41598-017-15702-0 |